Why A/B Testing Is the Wrong Default for Most Startups
Use historical behavior to value the lever, log every change as a Dimension, and keep measuring whether the decision remains true.

For most startups, A/B testing platforms are the wrong default.
I see the same pattern all the time. A team has an idea, puts half of its users in A and half in B, opens a tool, and waits for one metric to turn green. When the dashboard says the result is statistically significant, the team celebrates.
That process can produce a correct statistical result and still lead to a bad product decision.
There are three reasons. The team may be testing a change to something that does not drive the business outcome. The test may be too small or too short to support the decision the company wants to make. And the analysis may confuse randomized assignment with actual exposure—using the overall randomized comparison to explain a local mechanism, or filtering on behavior the treatment changed.
My problem is the default workflow: build a variation, rent another platform, split limited traffic, and let a temporary significance badge stand in for a maintained business decision.
Compare significance-first and analytics-first experimentation
Significance first
Build a variation, split traffic, and wait for a dashboard to declare a winner.
Analytics first
Use existing variation, log each new change as a Dimension, and keep measuring what remains true.
Do not experiment before you know what lever you are pulling
Imagine a website with a View pricing button. The button is buried in the navigation, so the team makes it more visible. The variation increases clicks to the pricing page by 30%.
That sounds like a win. It may only prove that a visible button gets more clicks.
The business probably does not care about pricing-page clicks by themselves. It cares about something downstream: qualified lead submissions, purchases, activated accounts, or revenue. Before engineering changes the button, I want the data team to ask a more useful question:
Does the time it takes a visitor to reach pricing tell us anything useful about the outcome we actually care about?
We can start with historical behavior. Compare visitors who reached pricing within one minute, five minutes, ten minutes, or not at all. Look at their eventual lead-submission rate. Break the relationship down by acquisition source, device, new versus returning visitor, and other factors that might explain the difference.
This analysis does not prove that getting to pricing faster causes someone to convert. High-intent visitors may already know what they want, find pricing quickly, and submit a lead for reasons the button did not create. But most startup decisions do not require perfect causal isolation. They require enough evidence to act, a visible record of the change, and a way to see whether the relationship keeps holding.
-
01
Business outcomeQualified lead submitted
The decision that matters
-
02
Proposed leverTime to first pricing view
The historical relationship to inspect
-
03
InterventionMore visible pricing button
The product change being tested
-
04
Valid exposureThe button could be seen
Who could experience the difference
-
05
Decision evidenceLever, lead rate, and guardrails
What changed and what did not break
The rule: a button click is not a business outcome, and a historical association is not yet a causal result.
Most startup problems do not need an A/B test
Sometimes analysis tells you the lever is weak. Pricing speed may have almost no relationship to lead submission once you separate paid traffic from returning visitors. In that case, do not spend engineering time optimizing the button. Learn something more valuable about the user journey first.
Sometimes the change is an obvious repair. A broken link, inaccessible control, incorrect price, or misleading label is not improved by withholding the fix from half of your users. Test uncertainty, not basic correctness.
For a new change, instrument the change itself. Add its version, treatment, launch state, or relevant property as a Dimension on the customer activity. Then keep comparing the people who experienced it against the business outcome over time. The analysis survives after the launch window instead of becoming a screenshot inside an A/B testing tool.
Save a controlled randomized split for the rarer case where the change is genuinely new, the uncertainty is high stakes, and the historical data cannot answer it. A/B testing is an expensive specialist method, not the tax every product change must pay.
This is where observed customer journeys keep the change connected to what people actually did. The path tells you where to investigate, the Dimension records which change each person experienced, and the Slice keeps checking whether it mattered.
Problem twoStatistical significance is not the same as a useful decision
A p-value answers a narrow question under a statistical model. It does not tell you that the effect is large enough to matter, that the metric represents the business goal, that the implementation is valid, or that the result will survive the next month. The American Statistical Association makes this boundary explicit in its statement on p-values: statistical significance does not measure the size or importance of a result.
This matters in both directions. With enormous traffic, a tiny effect can become statistically significant even when nobody should care. With limited traffic and erratic behavior, a meaningful effect may remain uncertain because the confidence interval is wide.
Tools such as Statsig are useful here, and the strongest product guidance is more careful than the green-result culture around it. Statsig's power-analysis documentation starts with the minimum effect you need to detect and estimates duration from historical variance. Its sequential-testing guidance adjusts the method when teams want to inspect results before a fixed horizon.
The tool can calculate evidence under the design. It cannot decide what effect is worth shipping.
Time variation does not mean what many teams think it means
If conversion rises every September, that ordinary calendar change does not automatically invalidate a concurrent randomized A/B test. Both A and B are running in September. Random assignment is what protects the comparison from the shared movement.
But time still matters.
The mix of users may change. A novelty effect may fade. Weekdays and weekends may behave differently. The treatment may help new visitors and hurt returning ones. The effect measured this week may not describe the effect after the product, market, and acquisition channels change.
Microsoft's experimentation team has published a useful analysis of this external-validity problem. Across many experiments, treatment effects usually carried forward, but day-to-day volatility and learning effects created more large surprises than fixed-distribution assumptions predicted. Their conclusion was not to abandon experimentation. It was to use longer durations, time-series checks, holdouts, or continued measurement when the effect itself appears unstable.
Randomization handles
- A shared seasonal rise or fall during the test.
- Ordinary baseline differences averaged across the assigned groups.
- A causal comparison inside the measured test window.
You still need to check
- Minimum detectable effect and confidence intervals.
- Day, week, channel, device, and user-mix stability.
- Novelty, delayed outcomes, and whether the effect persists.
So I would not ask only, “Did the test reach significance?” I would ask:
- What effect was large enough to change our decision before we saw the result?
- Could our traffic and historical variance detect that effect in a useful amount of time?
- Does the treatment effect remain directionally coherent across the business cycles that matter?
- Is the interval narrow enough to rule out a result we would regret shipping?
- What will we keep measuring after the experiment ends?
This is what I mean by asking whether the change beats the normal squiggly line. Do not replace the randomized comparison with a before-and-after chart. Use the company's historical behavior to design the test, interpret its uncertainty, and decide whether the measured effect is durable enough to matter.
Problem threeAssignment is not exposure
The analysis mistake I see most often is treating assignment and exposure as if they answer the same question. A standard experiment report compares everyone randomized to A with everyone randomized to B. That intention-to-treat comparison is correct and should remain the primary estimate of total business impact.
But half of those people may never scroll to the section containing the changed pricing button. They were assigned to an experience, but did not experience the change. Their inclusion can dilute the measured effect of the local mechanism; it does not invalidate the intention-to-treat estimate. The mistake is asking that overall estimate to explain what happened among people who could encounter the changed control.

The fix is not to replace intention-to-treat analysis or assign the user after they click the button. A click would condition the analysis on behavior the treatment may have changed. Keep stable assignment and the overall randomized comparison, then add a valid exposure event for a supplementary triggered analysis. The process separates two events and two reads:
- Assign before rendering. Give the user a stable A or B assignment before the changed experience appears, and keep that assignment consistent.
- Keep the overall comparison. Intention-to-treat analysis tells you the total business impact across everyone assigned, including the practical effect of limited reach.
- Log exposure at a treatment-invariant trigger. Use eligibility known before treatment when possible. Otherwise, record a counterfactual trigger that includes a user when either version could expose them.
- Make control and treatment comparable. Identical per-variant visibility code is not enough when the treatment can change layout, loading, eligibility, or whether the section enters the viewport.
- Add the triggered comparison. As a supplementary read, the population selected by that treatment-invariant trigger can show whether the local mechanism moved among people who could encounter it.
- Test the plumbing. Check assignment ratios, missing telemetry, pre-exposure events, and the untriggered complement before trusting the result.
Triggered analysis can improve sensitivity and help explain the mechanism, but it can also introduce selection bias when the trigger depends on treatment. Treat it as a companion to the intention-to-treat result, not a replacement. Microsoft's pre-experiment guidance describes counterfactual logging that marks control users whom the treatment would have affected. Its post-experiment guidance requires the trigger to capture all users who were or would have been affected, then recommends sample-ratio and triggered-complement checks. Microsoft's KDD paper on sample-ratio mismatch shows how assignment, execution, telemetry, joins, or biased segmentation can make a clean-looking result untrustworthy.
For the pricing example, “the button was in the viewable section” is valid only if treatment cannot change whether or when the section qualifies. If button prominence changes layout, loading, or viewport entry, determine eligibility from a pre-treatment page state or evaluate both possible renderings and trigger on their union. “The user clicked the button” is not a valid trigger because the click is part of the behavior the experiment is trying to change.
The better processWhen a controlled split is truly necessary, run it in three phases
What business decision should improve?
What does history make plausible?
MDE, duration, exposure, and guardrails.
Did the change move the lever?
Did the business result improve safely?
Does the learned relationship still hold?
Phase one: identify the value of the lever
Start with the outcome. For the pricing example, that may be a qualified lead submission. Then study whether time to first pricing view has a useful, stable association with that outcome across relevant segments and periods.
If the relationship is weak, inconsistent, or fully explained by obvious differences in intent, stop. If it is strong enough to justify a causal question, define the smallest improvement worth shipping and the guardrails that must not regress.
Phase two: test both the mechanism and the business result
Run the change with stable assignment and valid exposure logging. First ask whether the intervention changed the proposed lever: among eligible, assigned users, did the new button reduce time to first pricing view?
Then ask whether the business outcome improved across the randomized groups. Did qualified lead submission rise? Did lead quality, support contacts, bounce rate, performance, or another guardrail get worse?
This two-layer read matters because the implementation can change the lever without producing the expected outcome. A more prominent pricing button might send curious visitors to pricing faster while reducing the clarity of the page or attracting lower-intent submissions. The experiment tests whether this particular intervention caused this result—not whether every possible version of the lever will behave the same way.
Phase three: keep the learned relationship alive
After shipping, leave the analysis running on a sensible cadence. Monthly may be right for a startup website; a higher-volume product may need weekly monitoring and a slower decision metric may need quarterly review.
Track the lever, the outcome, the guardrails, and the segments that mattered. If time to pricing stops predicting qualified leads, if the treatment effect fades, or if the acquisition mix changes, the team should know that a decision it once trusted is no longer supported in the same way.
This is the part experimentation tools cannot own for you. Someone has to maintain the definition of a qualified lead, the exposure event, the historical baseline, the decision threshold, the segment logic, and the reason the company made the change.
That is the data work around the test. It is why Polyform connects business decisions to maintained definitions, evidence, work, review, and change history instead of treating one scorecard as the end of the process. The same principle applies to agent evaluation: define the real business job and independent checks before celebrating completion, as I explain in the outcome-contract approach to measuring AI agents.
What the full analysis looks like in Polyform
Here is the complete handoff using synthetic Northlane data. It moves in four steps: choose the strongest observed option, check whether the overall difference is reliable, test whether it has survived time, and then decide what to change and keep measuring. The shorter product launch update shows the same reasoning in the current customer-path and Slice interface.
1. Pick the best observed option
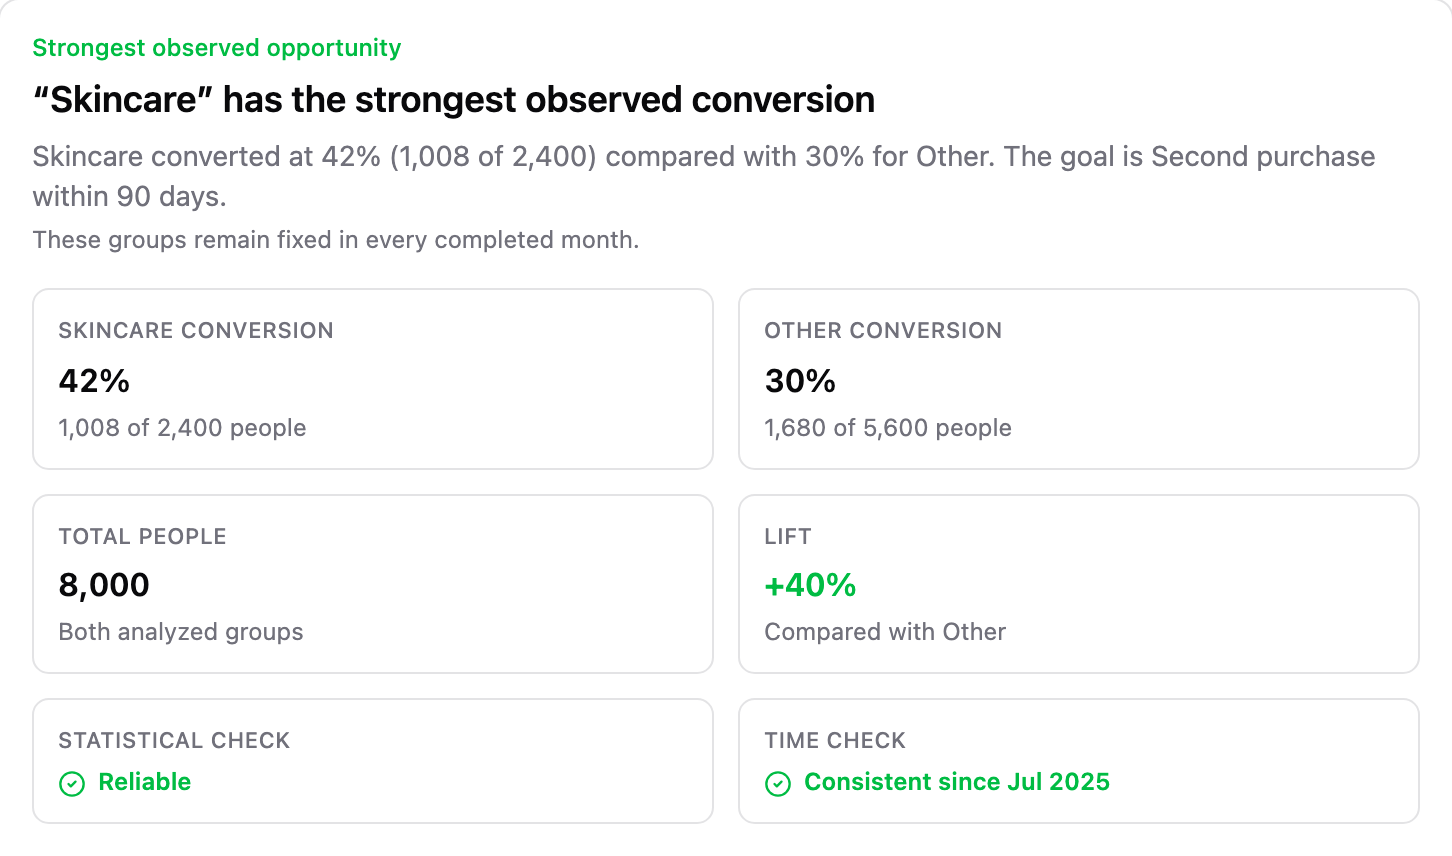
Start by comparing the candidate groups against the business outcome. Polyform finds that customers whose first purchase was Skincare reached a second purchase within 90 days at 42%, compared with 30% for the other categories. That makes Skincare the strongest observed opportunity in this analysis. It does not make Skincare the cause.
2. Check whether the overall difference is reliable
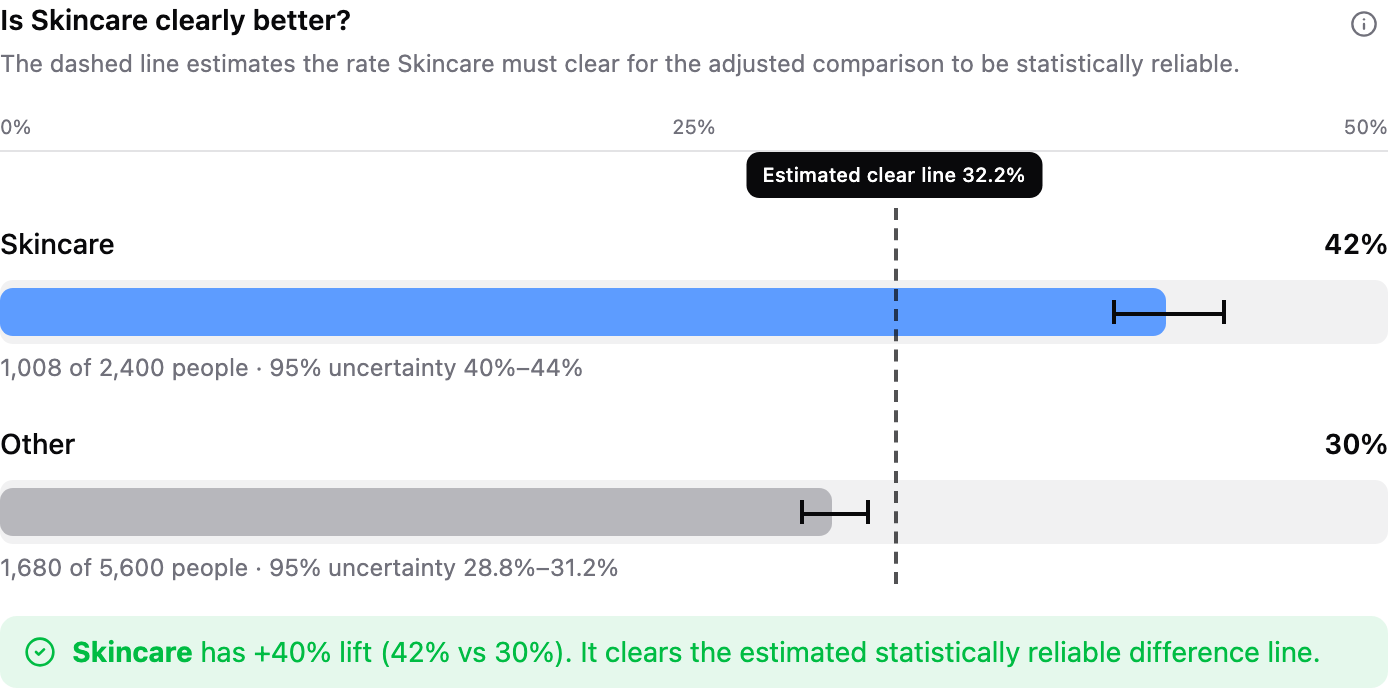
Next, test whether the 42% versus 30% difference is large enough to clear sampling uncertainty. The uncertainty ranges are shown on each bar, and the dashed line is the adjusted rate Skincare must beat after accounting for every candidate Slice comparison. Here, 42% clears the estimated 32.2% line.
This is where most analyses stop. A statistically reliable aggregate difference is useful—it tells us the result is unlikely to be explained by ordinary sampling noise under the model. It does not tell us that the pattern lasted, that it will continue, or that changing the cohort mix will cause the gain.
3. Test whether the result is durable over time
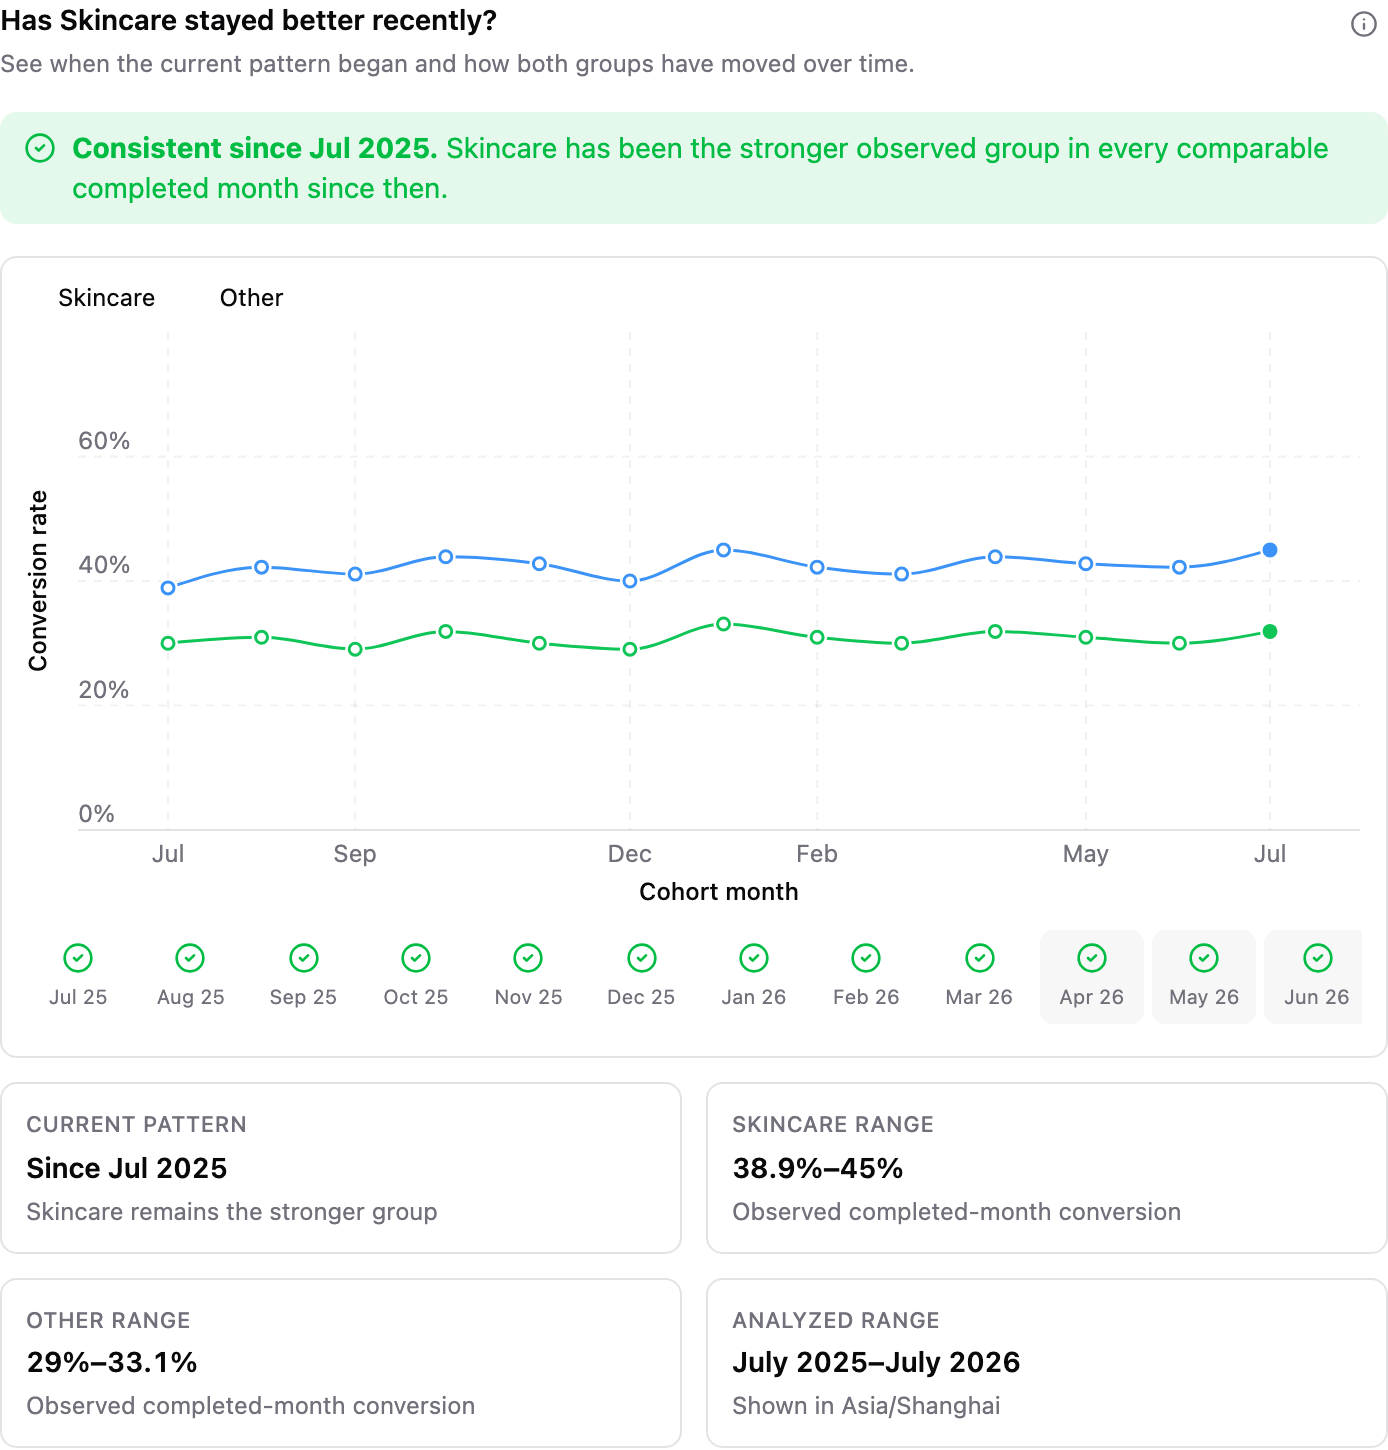
Now split the same fixed groups across completed months. Polyform checks whether the recent direction holds while still showing the longer history. In this example, Skincare remains the stronger observed group in every comparable completed month from July 2025 through July 2026. That time check makes a one-period spike much less likely to drive the decision.
This is not a collection of separate monthly significance tests, and it is still not causal proof. It is a durability check: does the aggregate opportunity survive the business cycles represented in the data, or disappear as soon as we look through time?
4. Turn the evidence into a bounded action
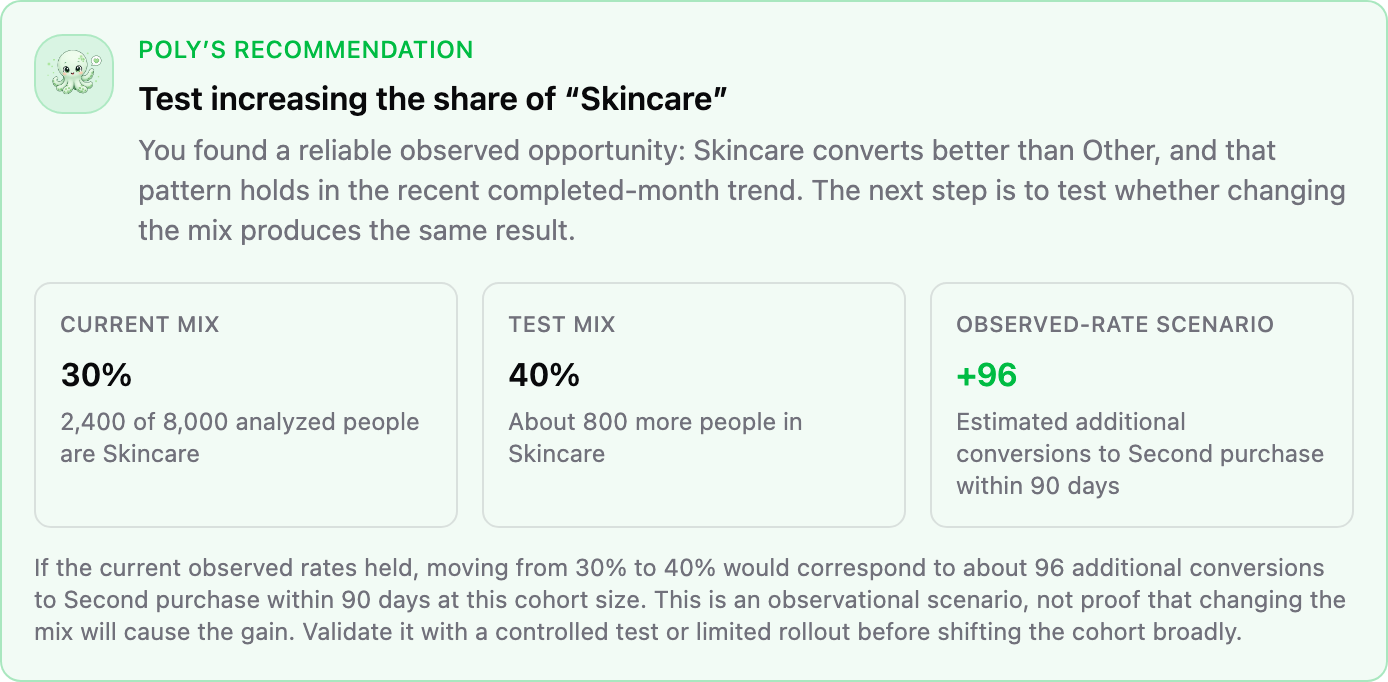
Only after both checks pass does Poly recommend an action: increase Skincare's share from 30% to 40%, log that share as a Dimension, and keep watching the same outcome. If the observed rates held, that shift would correspond to about 96 additional second purchases within 90 days at this cohort size. Poly keeps the boundary visible: +96 is an observational scenario, not a promised result.
The result should be a maintained decision, not a green badge
Most startups should not build their product-decision process around an A/B testing platform. They do not have Google's traffic, experimentation organization, or appetite for a separate system that freezes each decision inside a temporary window.
Use the variation already in the business. When you make a new change, log it as a Dimension on the customer activity. Keep the outcome, change, segment, statistical check, and time check together so the analysis can run again next week, next month, and after the business changes.
If a rare decision truly requires a controlled split, then implement it correctly: stable assignment, valid exposure, intention-to-treat, guardrails, and continued monitoring. But do not confuse the exception with the operating system.
The goal is a better decision—and knowing when that decision stops being true.
References and further reading
- American Statistical Association: Statement on Statistical Significance and P-Values
- Google Research: Overlapping Experiment Infrastructure
- Statsig documentation: Power Analysis
- Statsig documentation: Frequentist Sequential Testing
- Microsoft Experimentation Platform: External Validity of Online Experiments
- Microsoft Experimentation Platform: Patterns of Trustworthy Experimentation, Pre-Experiment Stage
- Microsoft Experimentation Platform: Patterns of Trustworthy Experimentation, Post-Experiment Stage
- Microsoft Research: Diagnosing Sample Ratio Mismatch in Online Controlled Experiments