A/B Testing Done Right Is Now Live in Polyform
Use historical behavior when variation already exists. For new changes, log the change as a Dimension and keep measuring it through time.
For most startups, A/B testing done right does not begin with an A/B testing platform.
During my days at Narrator, we had a template we called the Analyze button. The name was intentionally simple. We wanted to take a product idea—make this button easier to find, change this flow, promote this feature—and use the data a company already had to see whether the change mattered.
It was a response to two problems I kept seeing. First, teams ignored the variation already sitting in their backend and went straight to engineering, traffic splitting, and another platform. Second, a statistically significant result inside one chosen window was treated as the end of the story, even when the pattern changed from month to month.
I have wanted to bring that idea back for years. It is now live in Polyform.
Start with behaviorBuild the customer path before you build a test
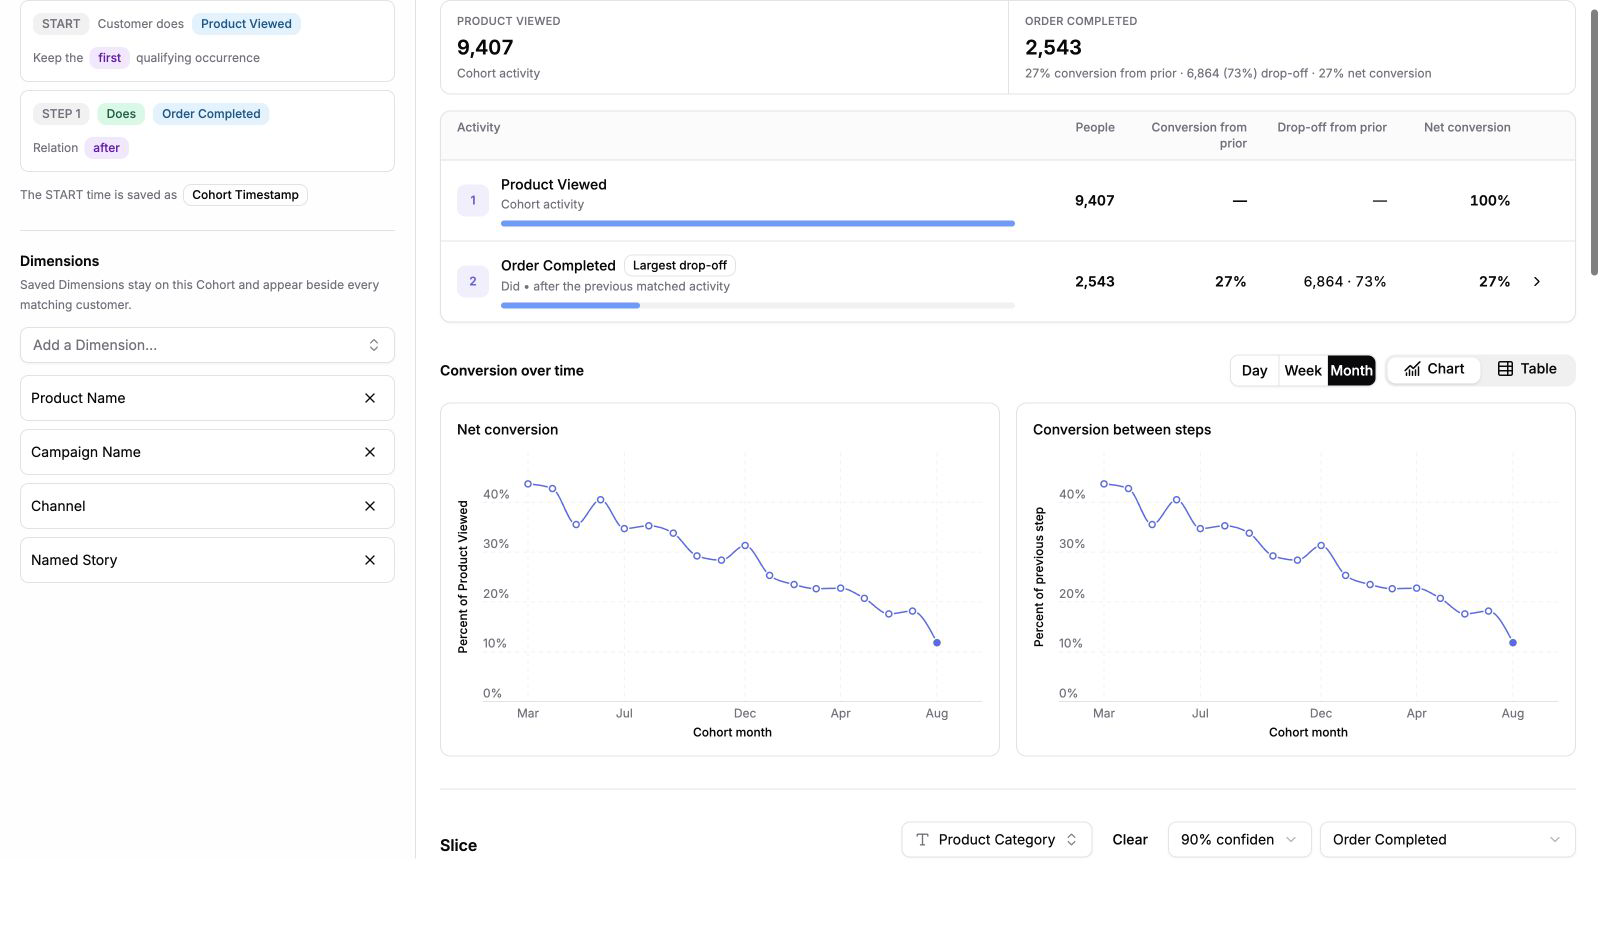
A cohort in Polyform can now be a path. Pick the activity that starts the population, add the next activity or conversion you care about, and choose how the events relate. The analysis shows the people at each step, conversion from the prior step, drop-off, net conversion, and how the path changes over time.
The saved Dimensions stay with the cohort. You can add fields such as Product Name, Campaign Name, Channel, or a business-specific story; inspect the matching people; and export the result. It feels familiar if you have used a CDP, but the path remains connected to Polyform's modeled Activities and customer history.
Turn any conversion into a Slice
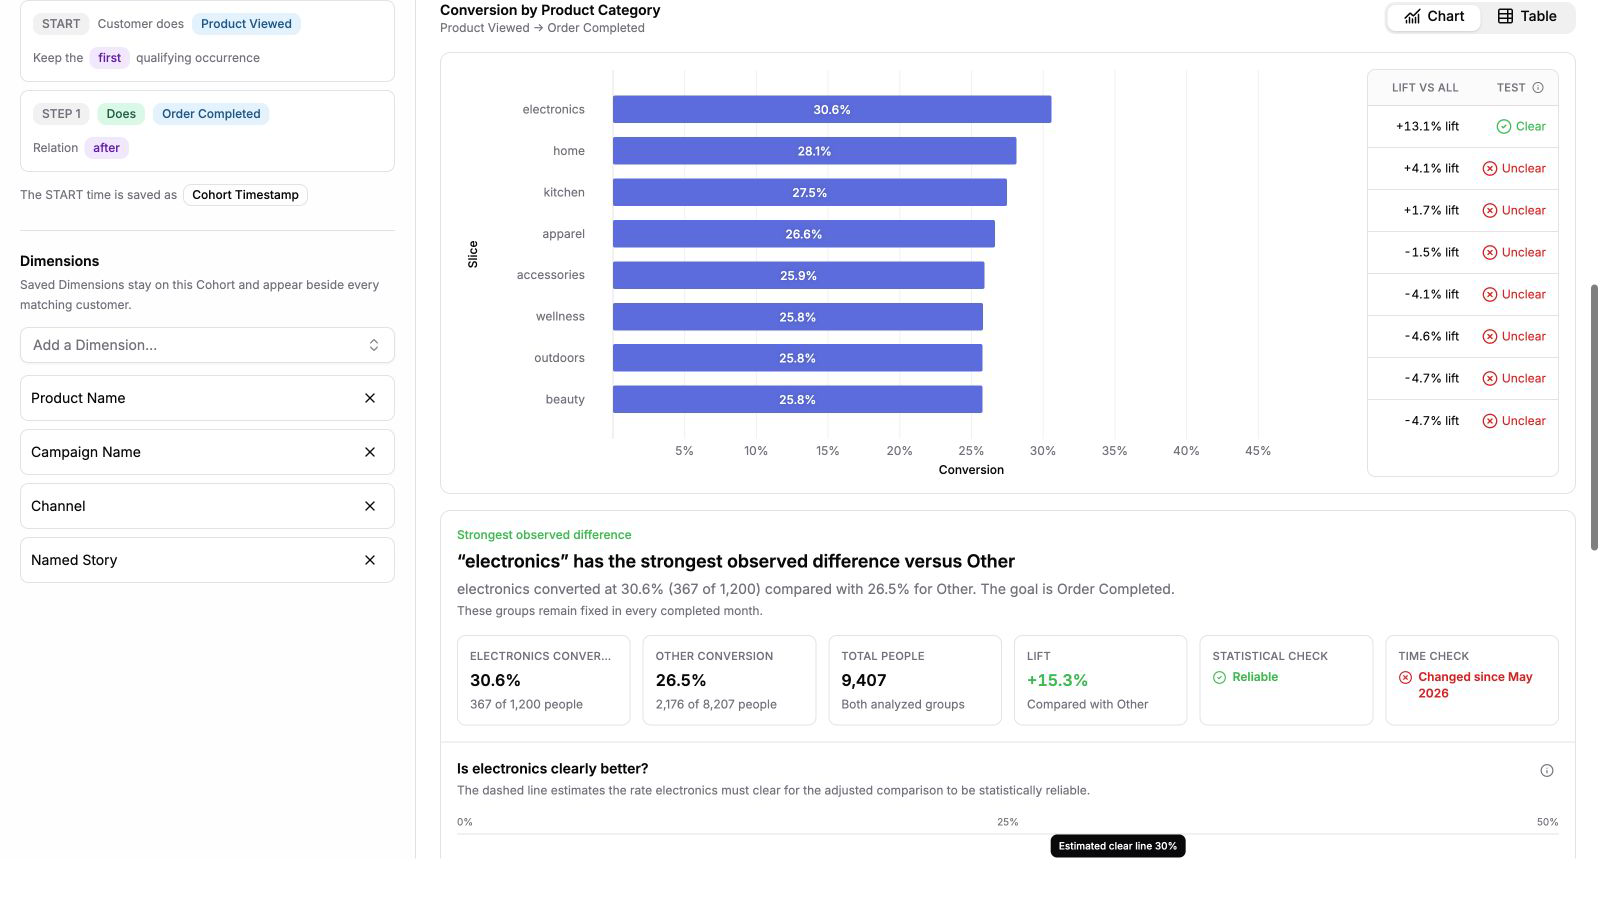
The next question is usually, “What seems to make this conversion better or worse?” Choose a Dimension and Polyform creates a Slice across the path. For categories, it compares the relevant groups. For a numerical Dimension, it forms useful ranges instead of making you hand-build every bucket.
Then it does something important: it looks across the candidates and identifies the strongest observed difference against the actual conversion step. You can change the Dimension, the confidence level, or the conversion step and run the same reasoning again. It becomes very easy to slice and dice the journey without rebuilding the analysis every time.
Explore it yourself
- Define the path and conversion
- Add saved Dimensions
- Choose a Slice and inspect the evidence
Ask Poly
- Describe the outcome and population
- Let Poly configure the same product objects
- Review the Slice, checks, and next decision
The analysis does not disappear into chat. Poly and the person work against the same saved cohort, Dimensions, and evidence.
A statistical check and a time check are different questions
The statistical check asks whether the observed difference is larger than we would expect from sampling error under the comparison. Polyform shows the uncertainty ranges and the estimated line the leading group needs to clear. That is much easier to understand than a green badge with no visible threshold.
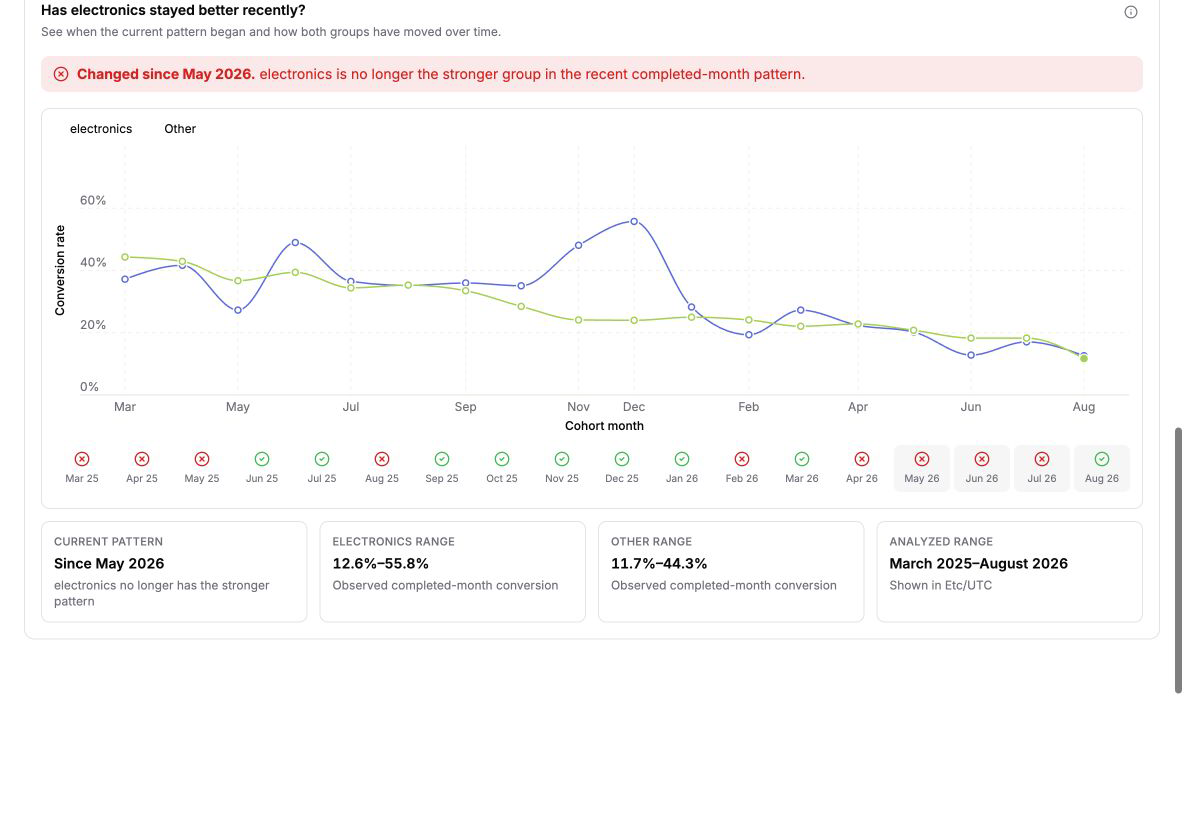
But this is where many analyses stop. Statistical reliability does not tell you whether the relationship stayed the same as the business, traffic, or customer mix changed. So Polyform runs a second check over completed periods and keeps the groups fixed through time.
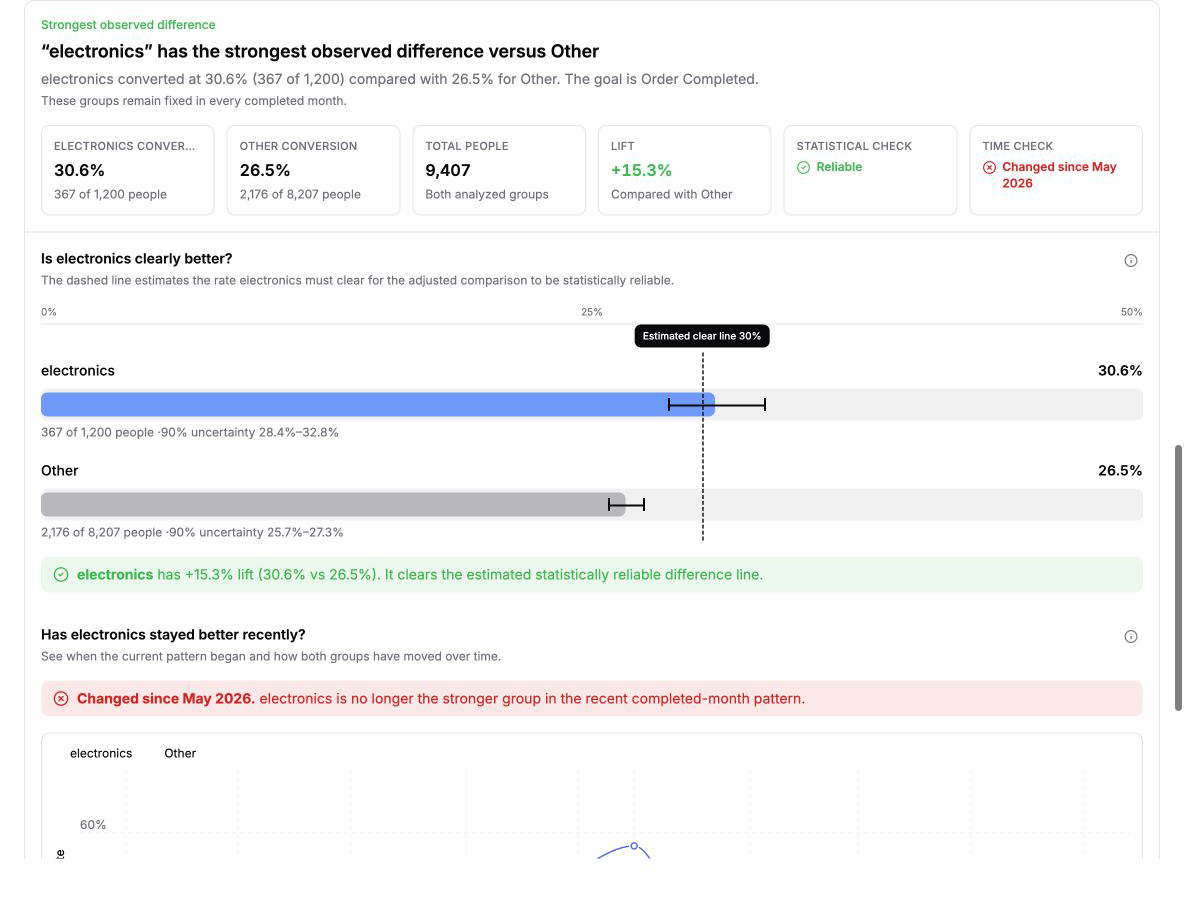
The current synthetic e-commerce example is exactly why I like the combination. Electronics converts at 30.6%, compared with 26.5% for everyone else. The aggregate comparison shows a 15.3% lift and clears the statistical check.
If I stopped there, I would call electronics the winner.
Then the time check changes the decision. Since May 2026, electronics is no longer consistently stronger. Some months it wins. Some months it loses. The overall result may reflect an earlier period that no longer describes the current business.
For most startups, this should replace the A/B testing platform
If the variation already happened, I would rather analyze the history than manufacture a new experiment to rediscover it. The history is faster, contains more business context, and lets me see whether the relationship survived different months, campaigns, customer types, and product conditions.
This is not pretending that a historical comparison and a randomized comparison answer the exact same statistical question. It is saying that most startup decisions do not need a temporary traffic split and a winner badge. They need enough evidence to make a good decision—and a way to notice when that decision stops being true.
A/B testing platforms are usually terrible at that job. They isolate one change inside one test window, collapse the result into a score, and encourage the team to move on. The business keeps changing, but the test becomes a screenshot from the past.
I would save a randomized split for the rarer situation where a genuinely new change creates a high-stakes uncertainty that the historical data cannot answer. It should be the exception, not the default workflow every startup has to buy and maintain.
And, of course, Poly can do the analysis with you
Cohorts, paths, Dimensions, and Slices are not a separate island inside Polyform. They are product objects inside the same system Poly can inspect and operate within your permissions. You can build the analysis directly, ask Poly to set it up, or continue the same question in conversation after you see something surprising.
That is the product I wanted when we called it the Analyze button: not a dashboard that declares a winner, but a living analysis that shows whether a change mattered, keeps the change in the customer history, and tells you when the relationship stops being true.