The aggregate moved. These are the people who moved it.
A percentage point of retention is a number. The accounts behind it are a list you can act on — if the customer is defined the same way in every system.
Aggregates hide the decision.
A dashboard can tell you retention fell. It cannot tell you which accounts to call this week, or whether they have anything in common.
The number is right, the action is missing
The metric is trustworthy and completely unusable. Nobody knows which customers it refers to.
Each system has its own customer
Commerce has an email, CRM has an account, support has a contact. None of them agree, so none of them join.
The list goes stale on export
A one-off CSV answers the question once. Next month somebody rebuilds it slightly differently.
One definition of the customer, reused everywhere.
One timeline per customer
Every meaningful thing a customer did, in one grain, so a new question does not need a new join.
From the aggregate to the account.
The path from a percentage point to a list of people, and then to an action.
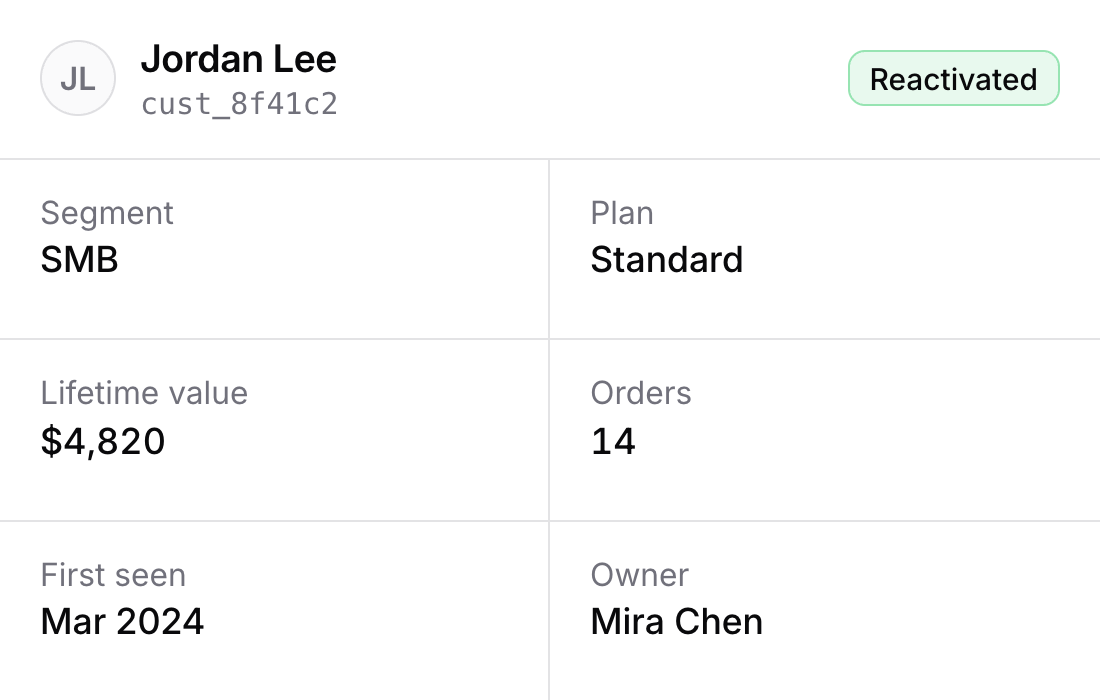
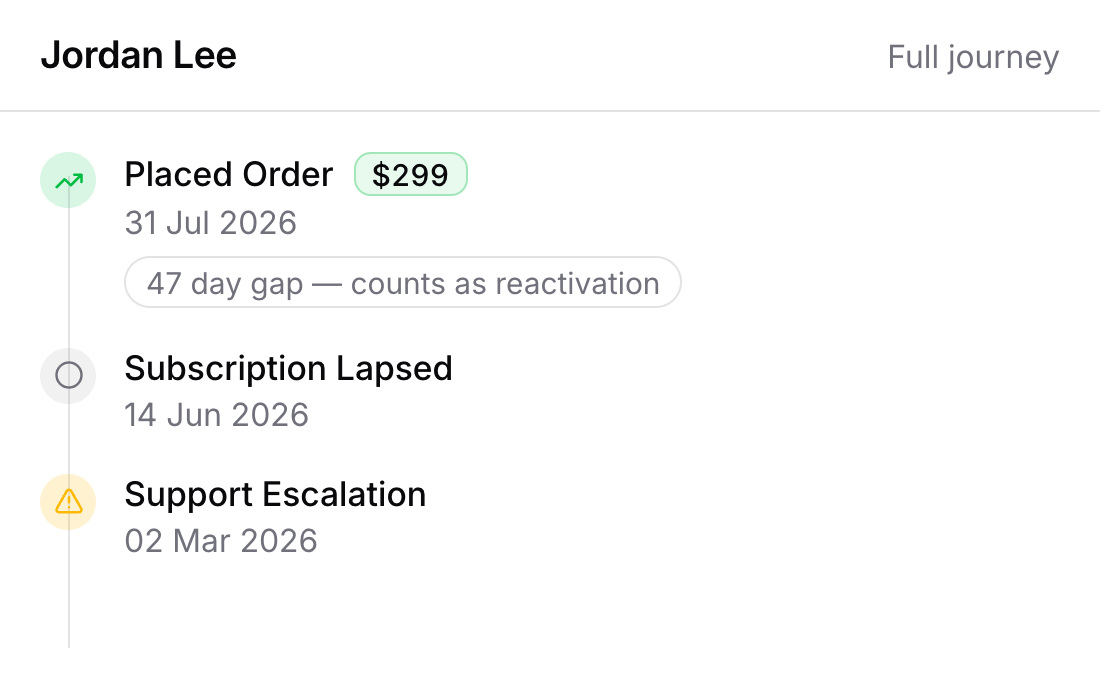
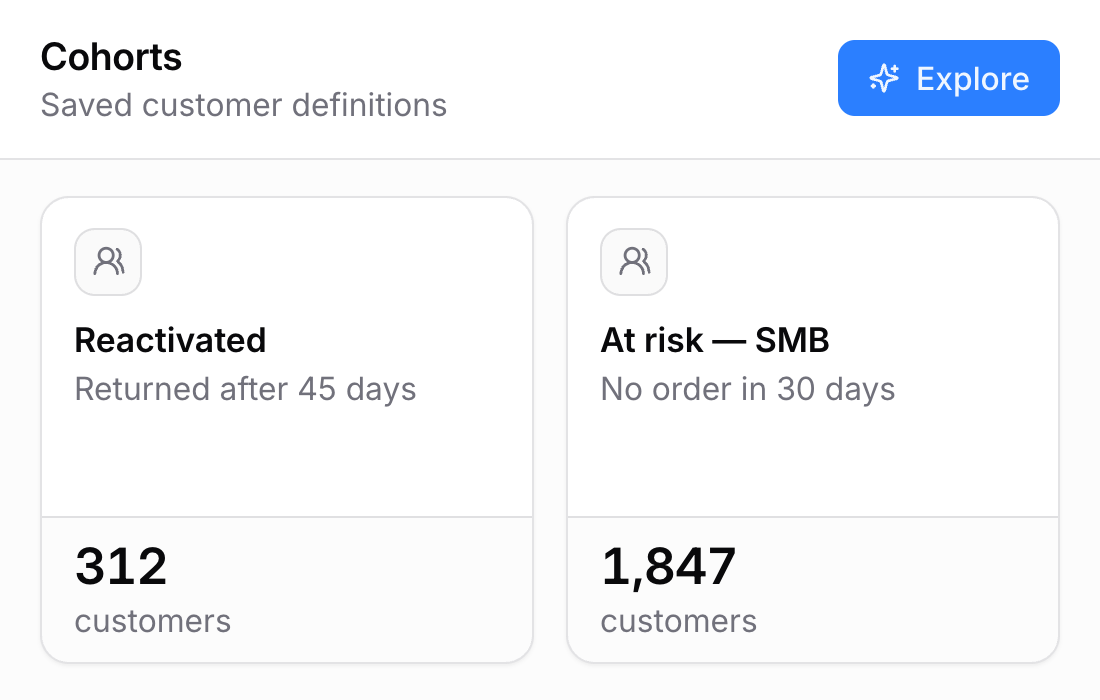
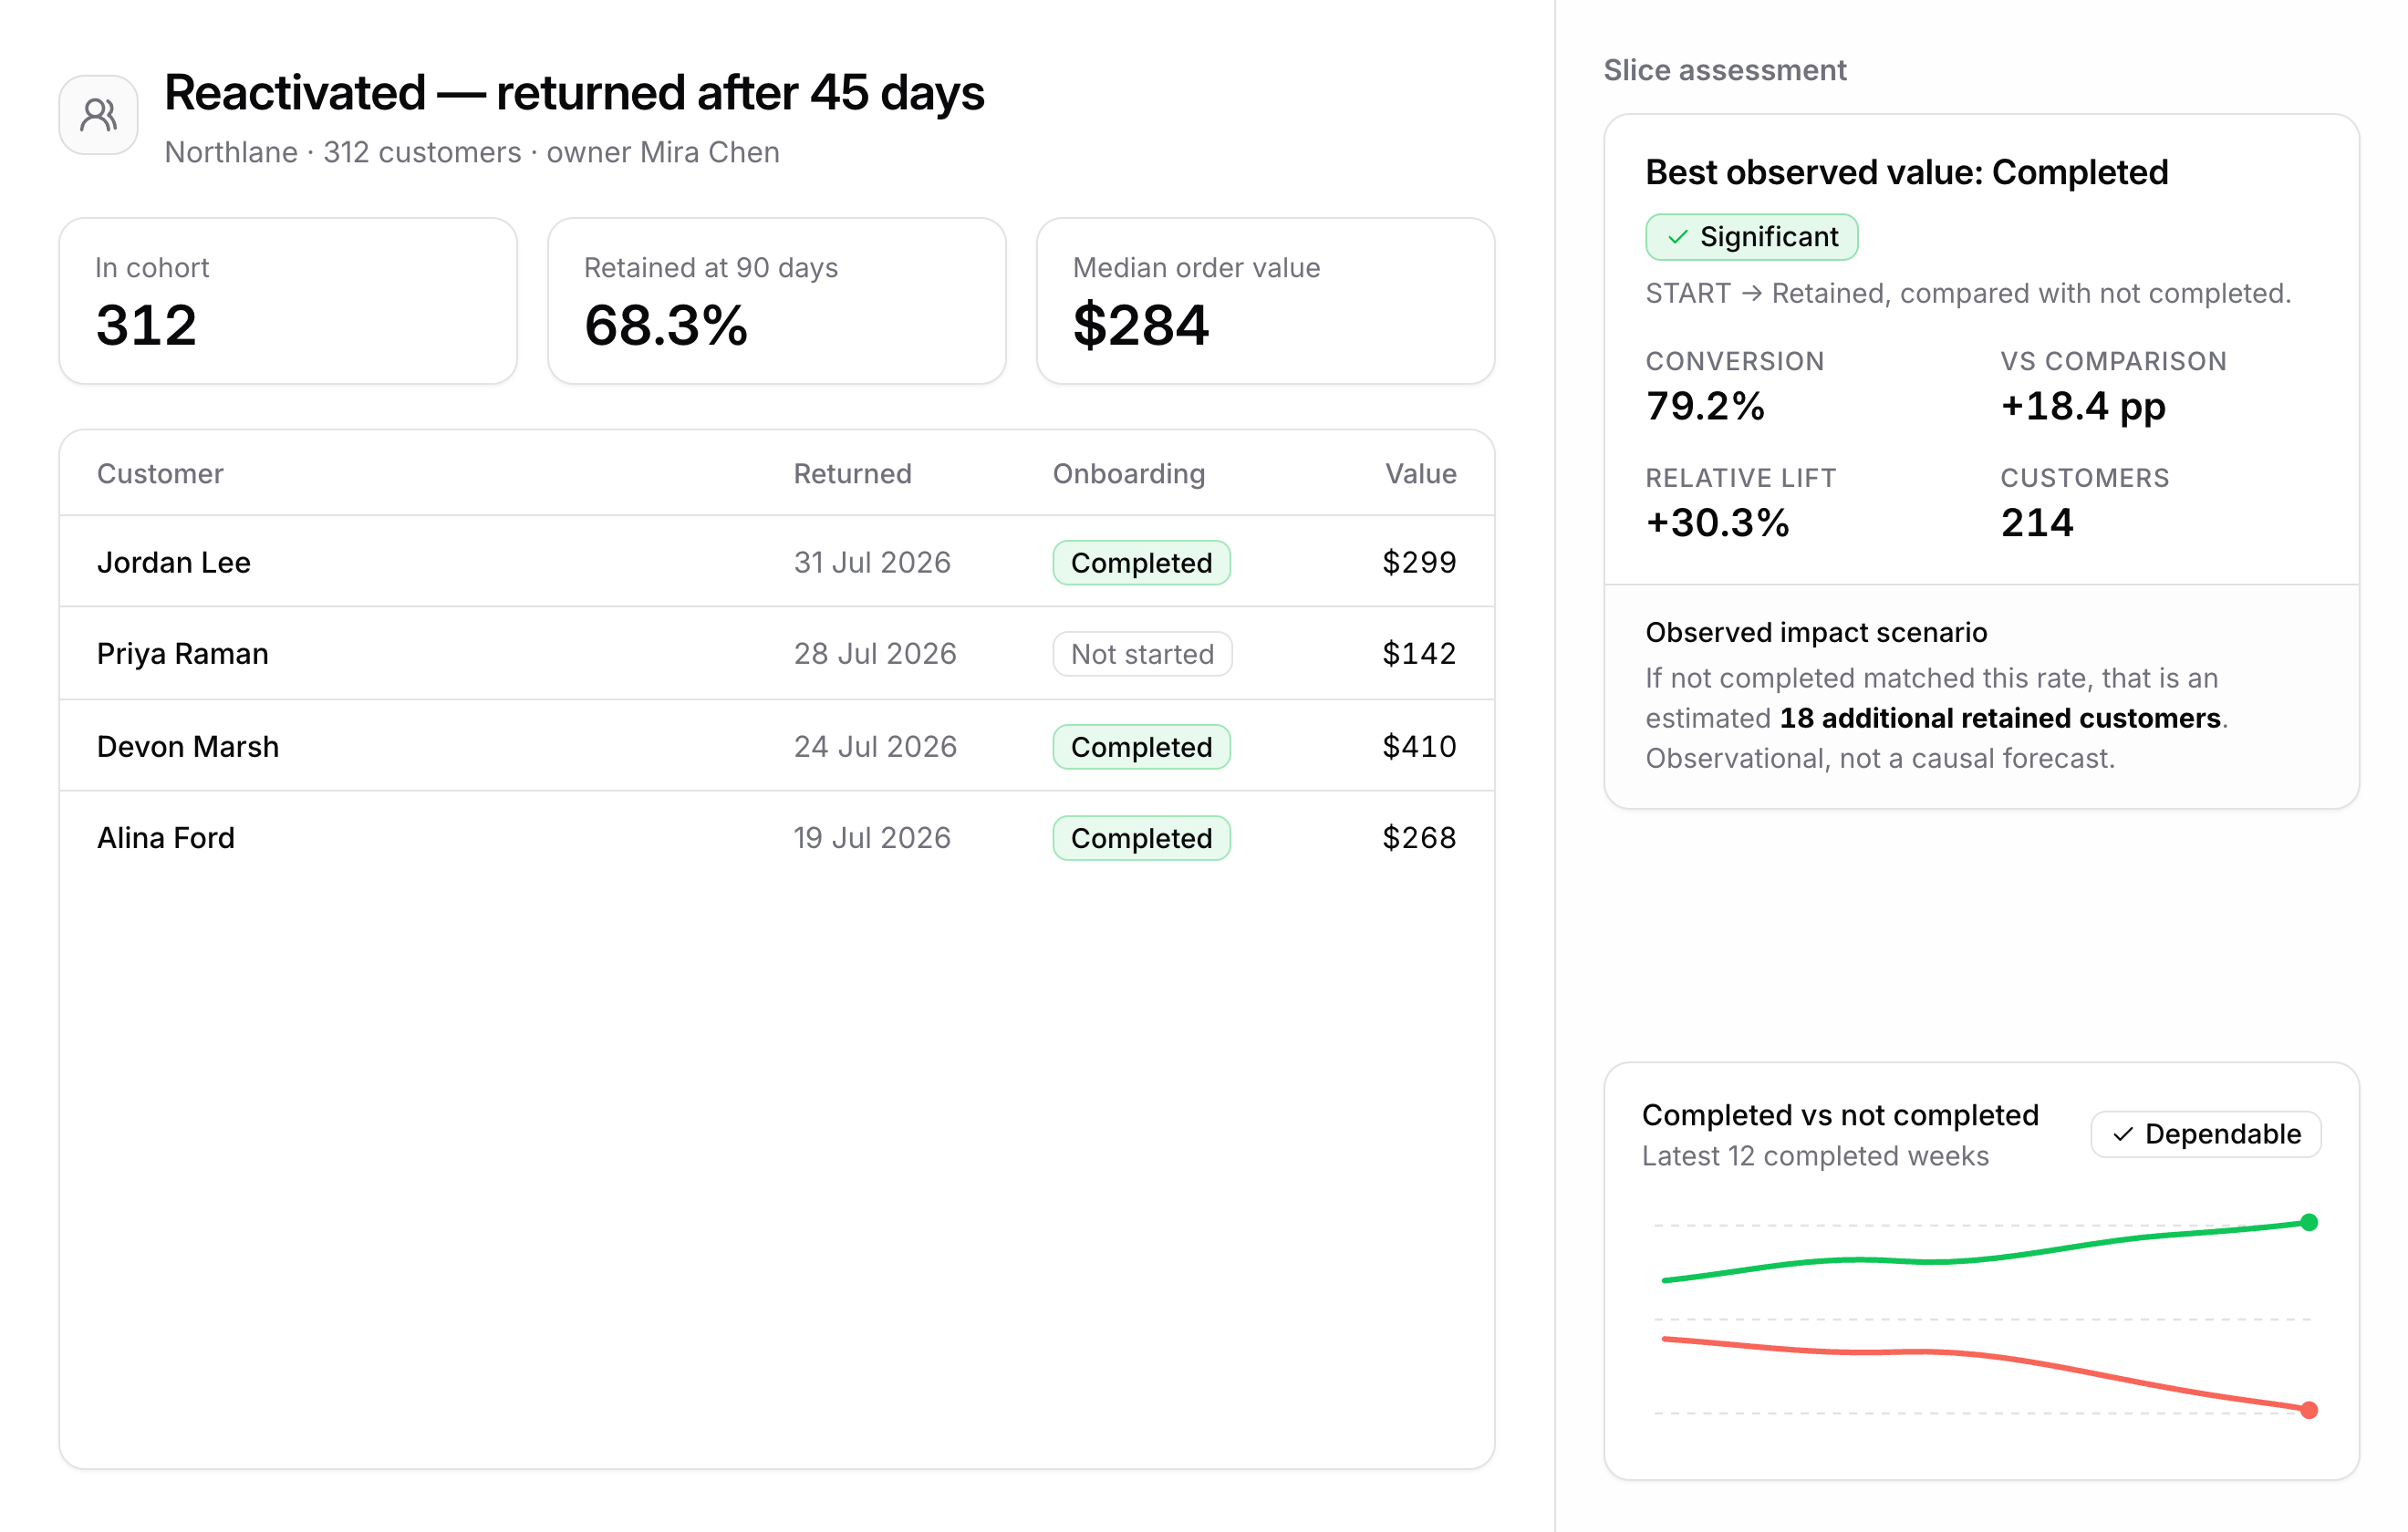
A cohort is only useful if it can leave the page.
The same definition that produced the analysis drives the action — so the list the team works is the list the report counted.
Build a segment, then follow it through a pathway.
A cohort is a saved object with an owner, not a filter somebody remembers.
The tables everything else is built on.
Primarily a data-expert tool — but available to everyone, because the definitions in it are what the rest of the system reuses.
Bring the aggregate you cannot act on.
One question, one cohort, one action the team can take on Monday.
Book a working session