How to Get More Out of AI for Data
A practical blueprint for giving AI access, analytical method, business meaning, system visibility, reusable structure, feedback loops, and escalation.
AI is already remarkably powerful for data work.
Connect ChatGPT, Codex, Claude, or another capable agent to a few company systems and it can find data, write SQL, calculate metrics, build charts, and explain what it sees. That first experience can feel magical.
It can also create the wrong lesson: that getting more value from AI is mainly a matter of connecting more tools.
Tools matter, but people do not experience data as a collection of tools. A leader does not wake up wanting to run a dbt model, inspect an Airflow job, and change a Tableau workbook. They want to know why conversion fell, which customers need attention, whether a launch worked, or what the company should do next.
The unit of work is the outcome. The tools are the path.
To get AI to operate that path, you have to build a system around it. And the layers of that system are different. Giving AI access is not the same as teaching it how to think. Teaching it how to think is not the same as defining your metrics. Defining your metrics is not the same as letting it inspect how a number was produced. And seeing the path is not the same as being able to repair it, verify the repair, and act on the result.
Here is the blueprint:
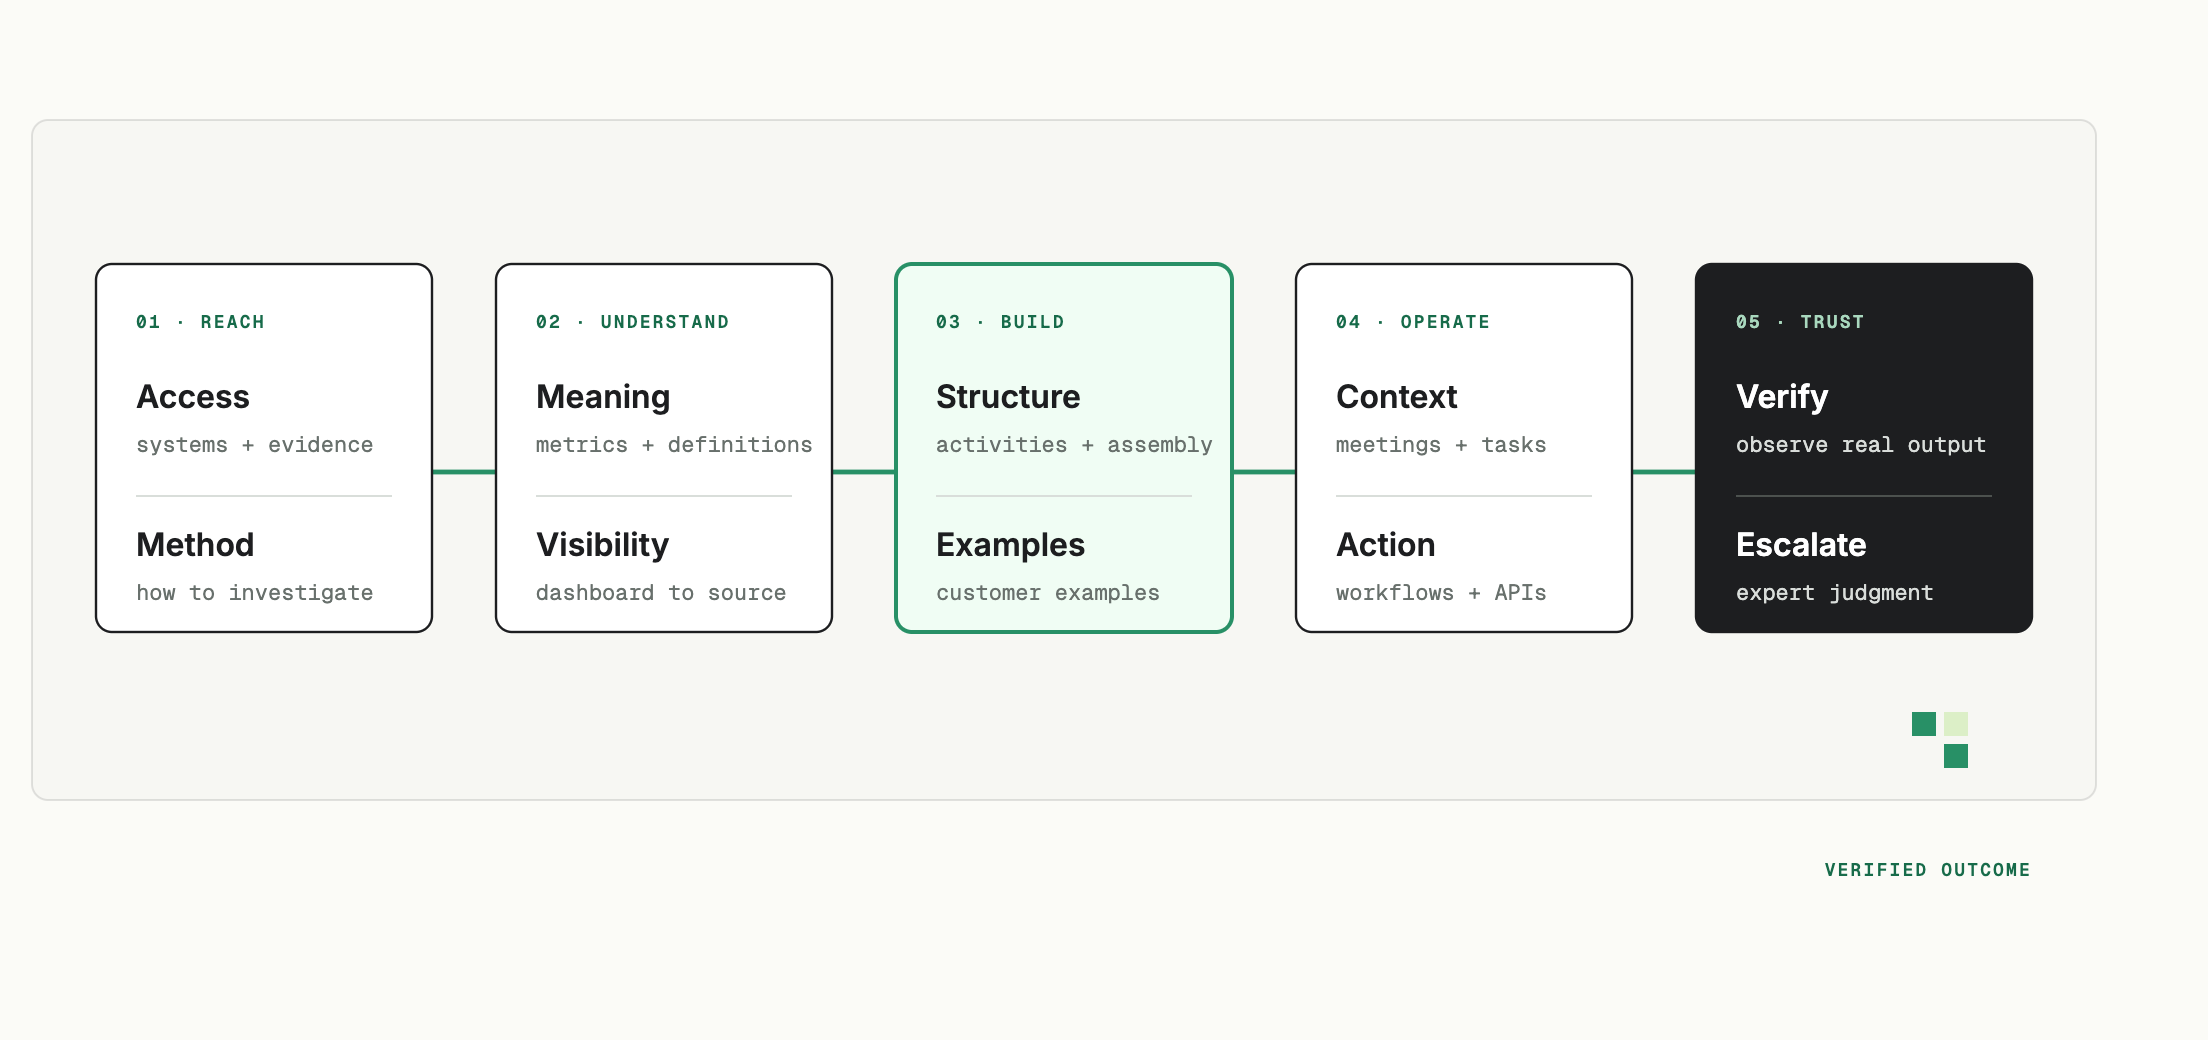
- Give it access: Connect the systems that contain the evidence.
- Give it a methodology: Teach it how to investigate a data problem.
- Give it business meaning: Supply governed metrics, definitions, and query context.
- Give it visibility: Let it inspect the complete path behind what a user sees.
- Give it structure: Represent the business with reusable activities and assemblies.
- Give it examples: Let it follow real customers and records through the system.
- Give it operating context: Connect the data to meetings, decisions, and tasks.
- Let it act: Give it bounded ways to build workflows and activate data.
- Close the loop: Make it build, run, observe, test, and repair its own work.
- Let it escalate: Give it an accountable expert when judgment is required.
Each layer makes the next one more useful. Together, they turn a smart assistant into a data system that can carry a business question from intent to a verified outcome.
1. Give the AI access to the systems that contain the work
Start with access. The AI cannot investigate evidence it cannot reach.
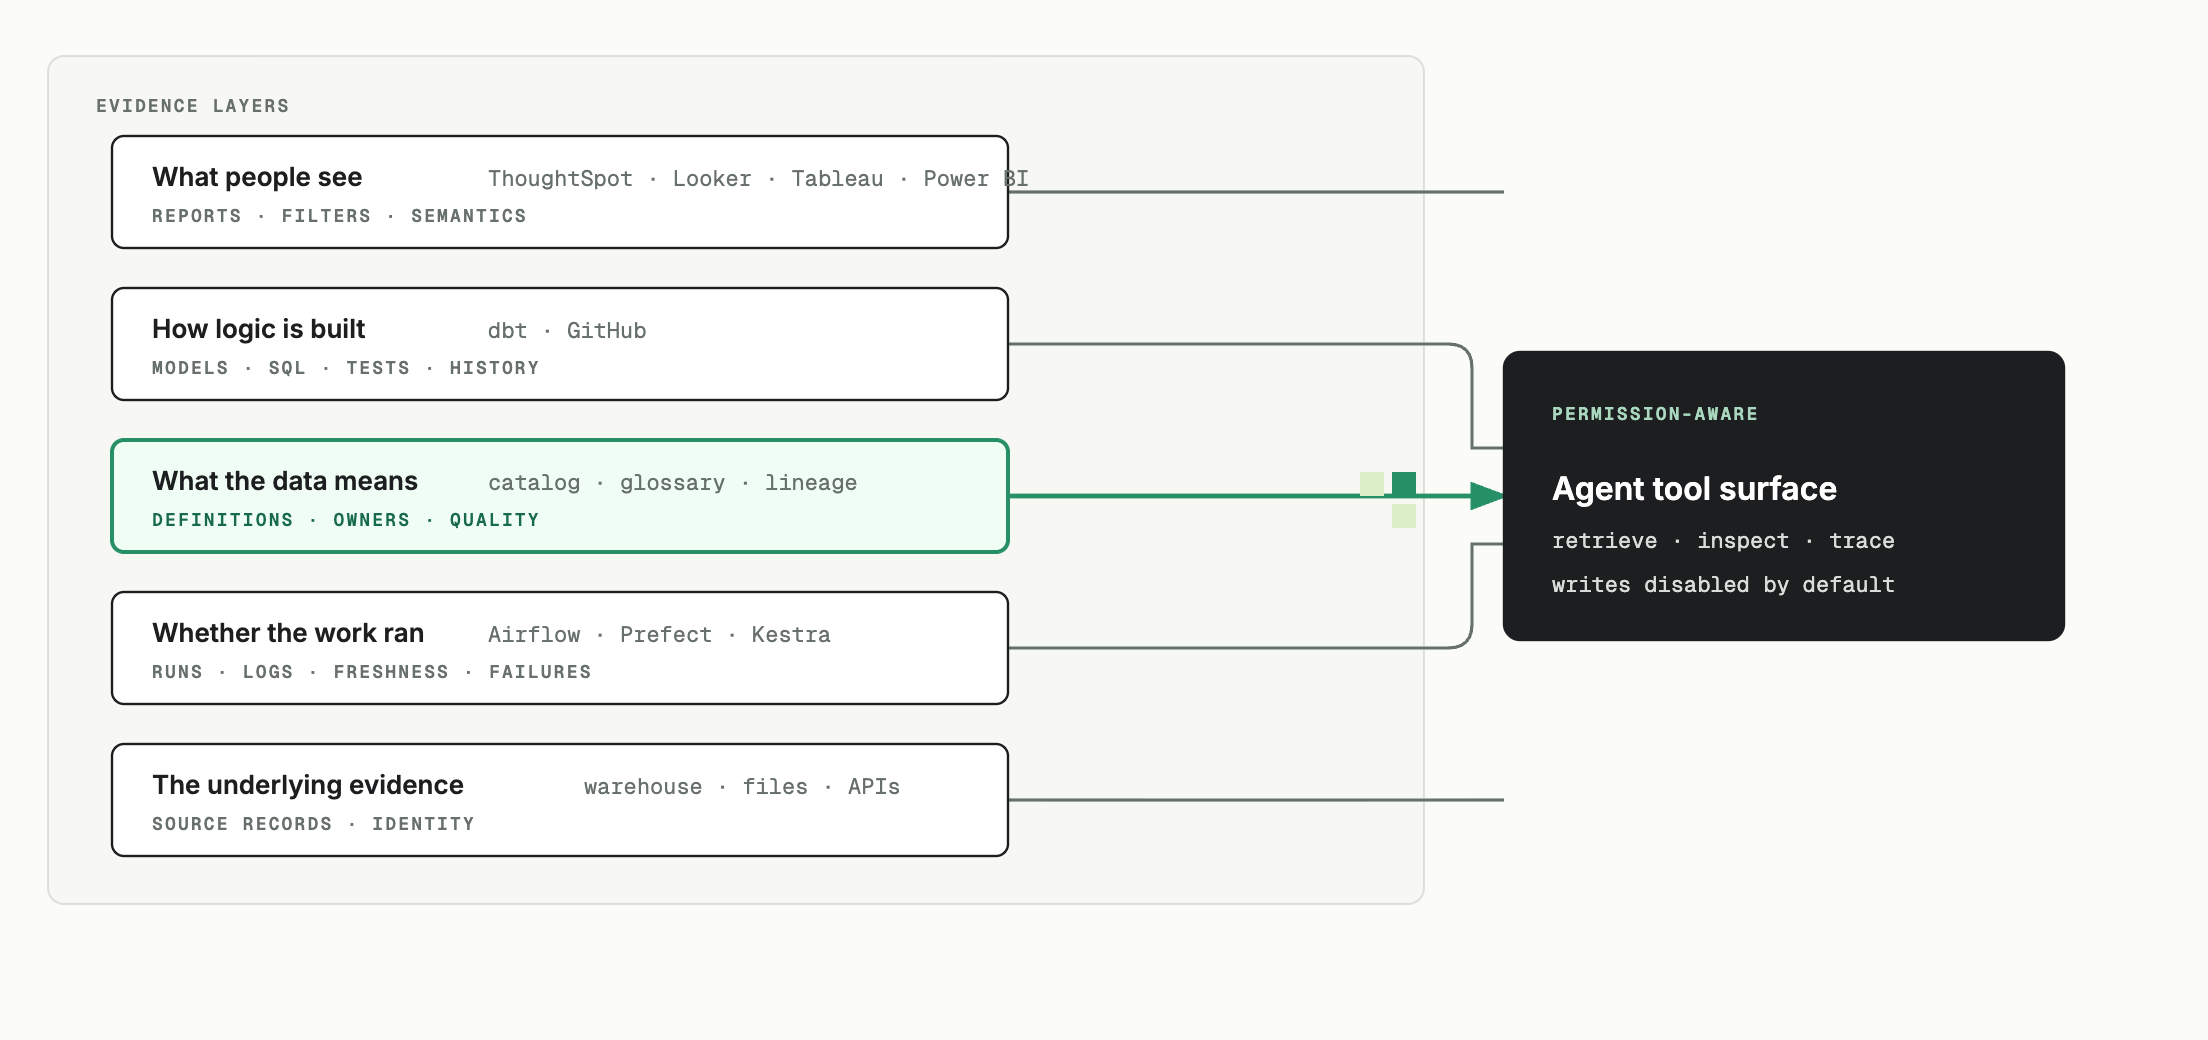
MCP servers, APIs, and connected applications can expose the tools an agent needs. For a modern data stack, the useful surface usually spans five parts of the path.
| Part of the path | What the AI needs to inspect | Practical connection options |
|---|---|---|
| What people see | Reports, charts, filters, saved views, semantic models | ThoughtSpot MCP, Looker-managed MCP, Tableau MCP, Power BI MCP |
| How the logic is built | Models, SQL, tests, pull requests, deployment history | dbt MCP plus the official GitHub MCP server |
| What the data means | Glossary terms, owners, schemas, lineage, quality, certified assets | Atlan MCP, DataHub MCP, OpenMetadata MCP, Collibra MCP, or Alation Agent Studio and SDK |
| Whether the work ran | Jobs, runs, task state, logs, freshness, retries, failures | Airflow’s public API, Prefect MCP, or Kestra’s AI tools |
| The underlying evidence | Warehouse tables, operational records, files, spreadsheets, source APIs | Your warehouse or database connector, scoped to the data needed for the task |
These connections are not identical. That matters when you implement them.
- ThoughtSpot, Looker, Tableau, and Power BI all publish official MCP paths, although availability and maturity vary by product and edition. Looker’s managed server, for example, is currently documented as a preview.
- dbt MCP can expose project context, SQL execution, Semantic Layer metrics, lineage, models, sources, and tests. GitHub MCP lets the agent inspect the repository where the dbt project and other query logic live. Start GitHub in read-only mode and enable only the toolsets you need.
- Atlan, DataHub, OpenMetadata, and Collibra now publish MCP servers for governed metadata. Alation exposes catalog context through its MCP-capable Agent SDK and Agent Studio. These are five common catalog and data-dictionary options to evaluate; the right choice is usually the one already trusted by your team.
- Airflow’s public API is the straightforward way to inspect DAGs, runs, and task state. Airflow also has an AI provider that lets Airflow agents call external MCP tools, but that is a different direction of connection. Prefect’s MCP server is primarily read-only for diagnostics, with its CLI or SDK used for changes. Kestra’s MCP endpoint supplies current product and plugin knowledge, while operational changes use Kestra’s own tools. Do not treat every “MCP integration” as the same capability.
Do not connect everything at once. Choose one consequential question and expose the smallest set of systems required to follow it. Keep permissions aligned with the person asking. Separate read access from write access. Record every action.
You are ready to move on when: the AI can locate the report in question, the logic behind it, the relevant definitions, the latest processing run, and a small set of source records—without a person copying and pasting the evidence into chat.
Access is necessary. It is still only a tool surface. The AI does not yet know how your team expects an analysis to be done.
2. Give it a methodology for how to think
The next layer is procedural context: a repeatable method for approaching an analytical problem.
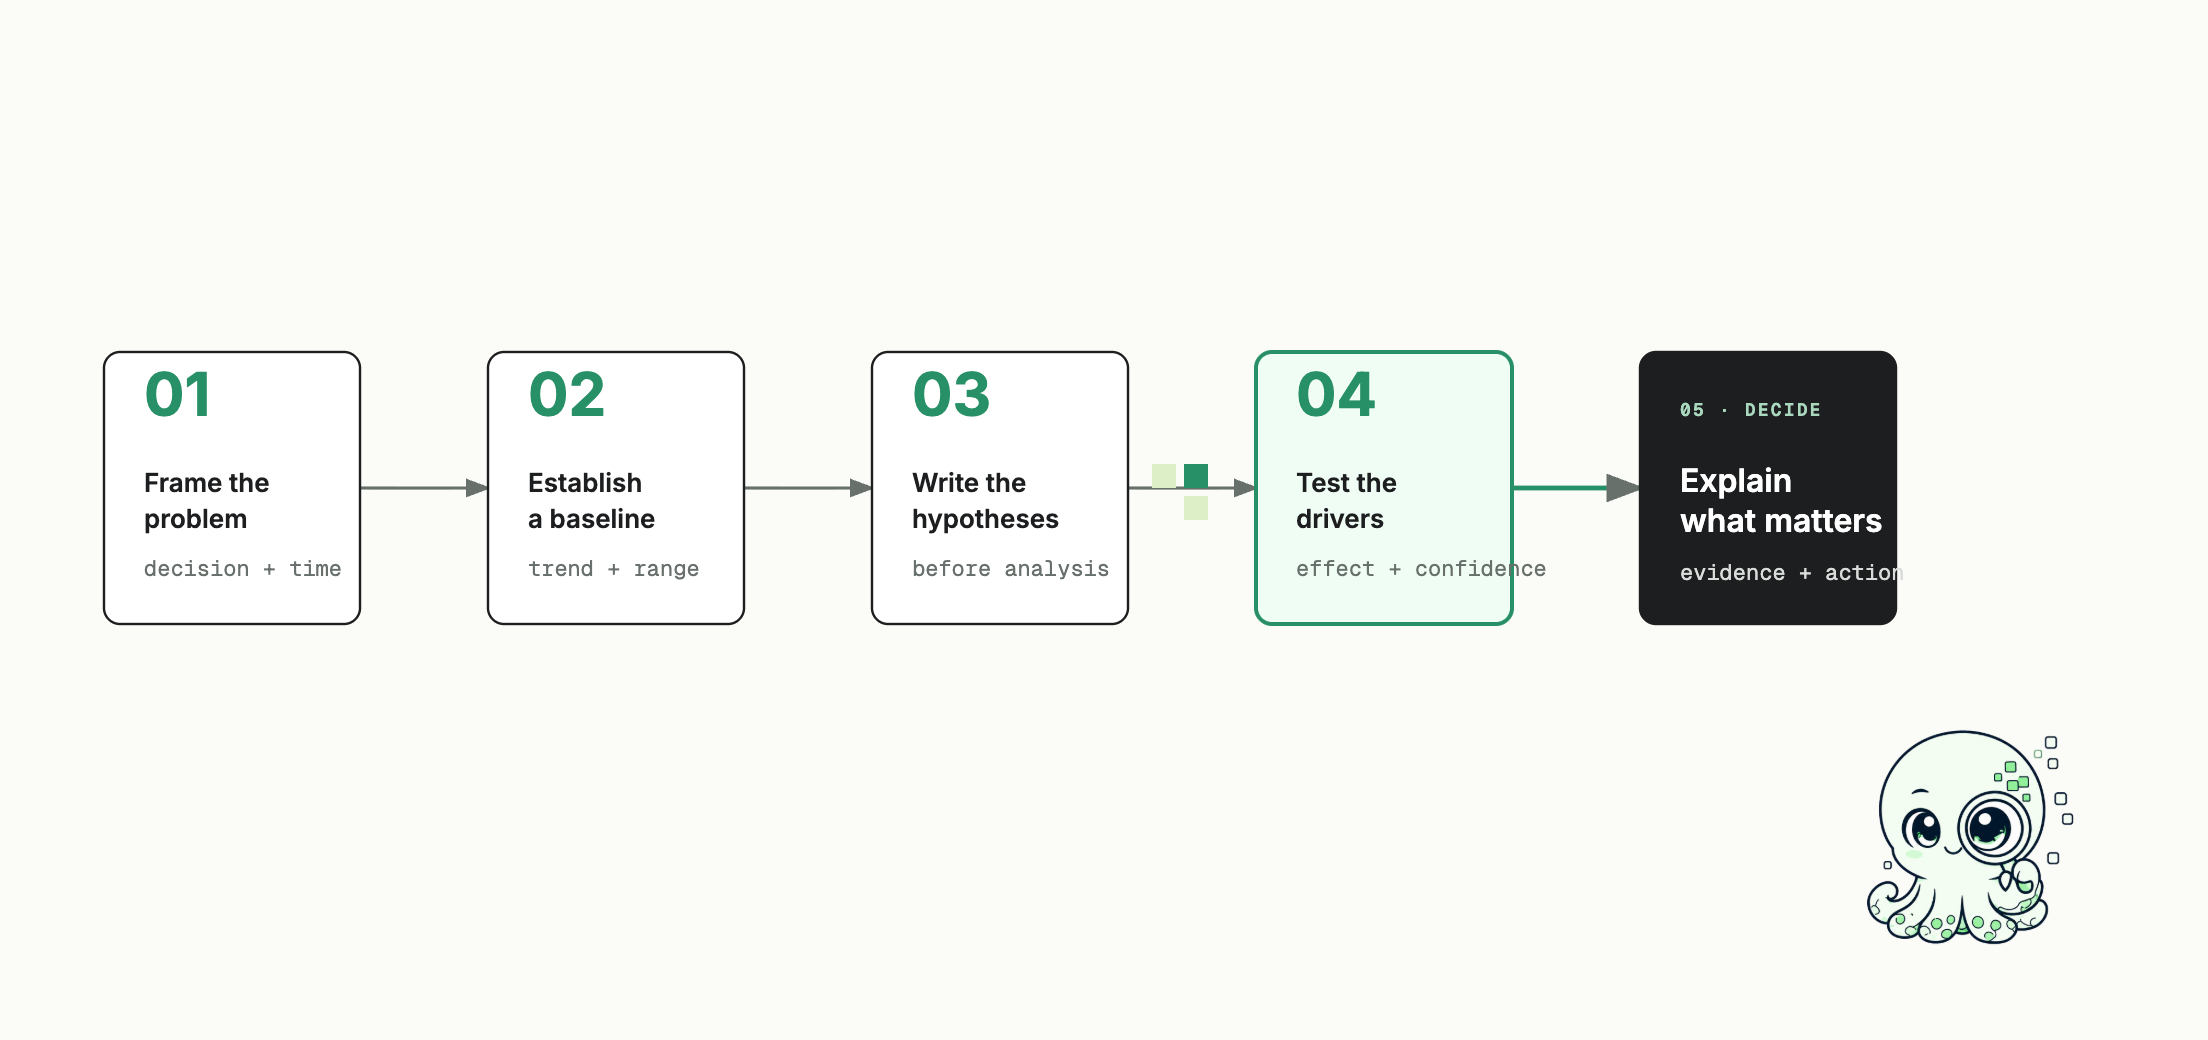
This should be separate from your metric definitions. The method tells the AI how to reason. The metric layer, which comes next, tells it what your business has decided a term means.
You can save the following as a skill, playbook, or reusable instruction:
# Skill: Investigate a business problem with data

When asked to investigate a business problem:

1. Clarify the problem, the decision it should support, and the timeframe.
2. Propose the metric or outcome that best represents the problem. Explain why
   it is useful and what it does not capture. Do not invent its definition;
   retrieve the approved definition from the business context.
3. Establish a baseline. View the metric over enough time to understand its
   trend, seasonality, normal variation, and any break in collection.
4. Write down plausible hypotheses before searching for explanations.
5. For each hypothesis, identify the measurable features or events that should
   change if it is true.
6. Test the relationship. Report direction, effect size, uncertainty,
   statistical significance, and practical importance.
7. Check important segments, missing data, alternative explanations, and real
   examples. Do not describe correlation as causation without a credible design.
8. Present the conclusion, evidence, uncertainty, and recommended next action.
   Link to the definitions, queries, and records used.
The important move is not the exact wording. It is externalizing the analytical method so the AI does not improvise a different process on every question.
For some teams, this becomes a small library of skills: investigate a metric change, evaluate an experiment, diagnose a funnel, validate a dashboard, analyze a cohort, or reconcile two reports. Skills can route the AI through different kinds of work while preserving shared standards for evidence and uncertainty.
You are ready to move on when: the AI begins with the problem and decision, retrieves rather than invents definitions, establishes a baseline, tests explicit hypotheses, and distinguishes a statistically detectable result from one that matters to the business.
Now it knows how to think. It still needs to know what your business means.
3. Give it metrics, definitions, and access to the queries behind them
Business meaning deserves its own layer.
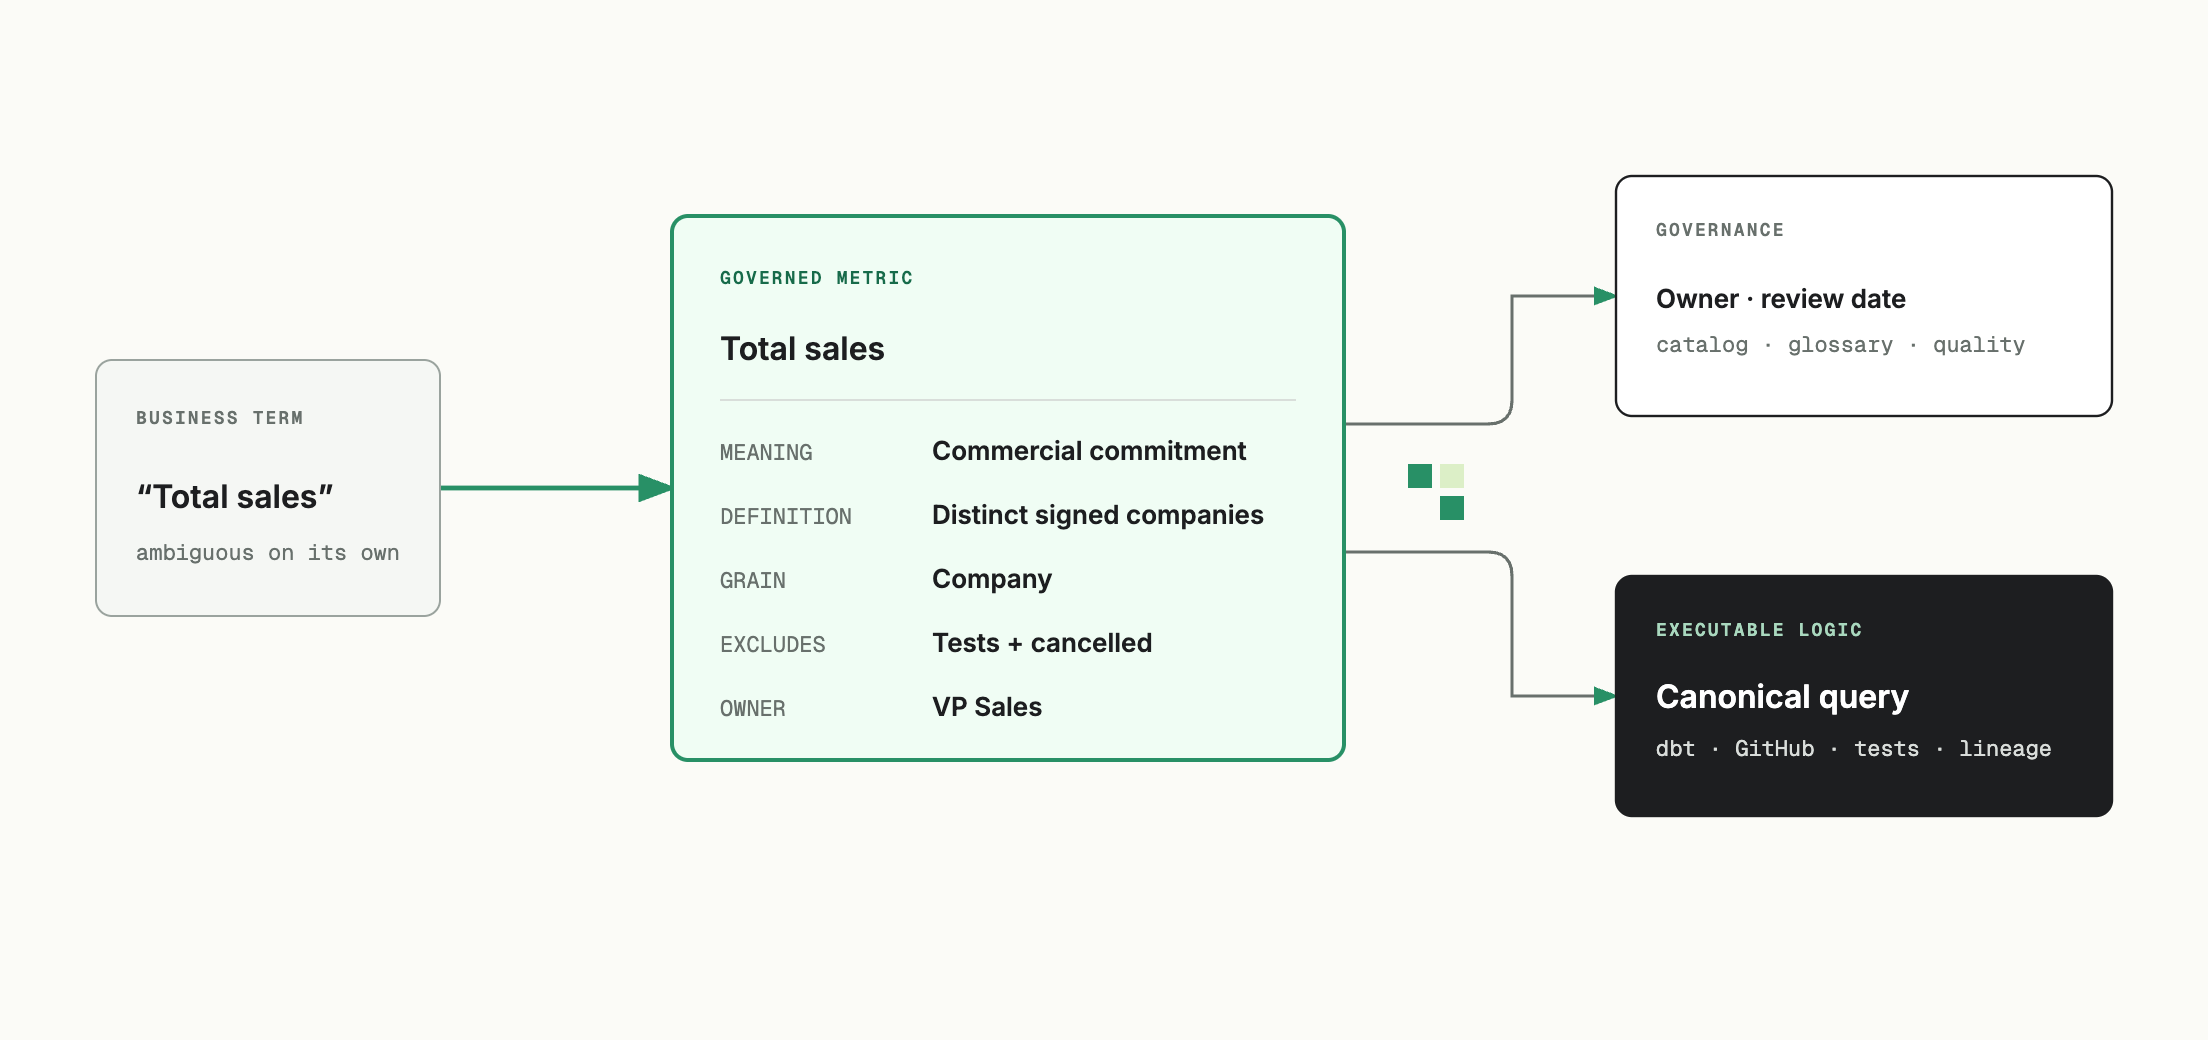
“Total sales” might mean contracts signed, subscriptions started, invoices issued, invoices paid, or cash received. A smarter model cannot resolve that ambiguity. The business has to decide, and the decision has to be available when the question is asked.
Create a governed metric card for every important metric. At minimum, include:
Metric: Total sales
Business meaning: Companies that made a commercial commitment.
Definition: Count distinct companies with a Signed Contract activity.
Time field: contract_signed_at
Timezone: America/New_York
Grain: company
Exclusions: test accounts and contracts cancelled before their start date
Dimensions: segment, owner, region, acquisition source
Owner: VP Sales
Source of truth: Signed Contract activity v3
Canonical query: analytics/metrics/total_sales.sql
Used in: weekly revenue report, board deck, sales-capacity workflow
Quality checks: no duplicate contract IDs; owner coverage above 99%
Last reviewed: 2026-08-12
The friendly definition and the executable logic must stay connected. Give the AI access to:
- The business glossary and data dictionary
- The semantic or metric layer
- Canonical saved queries
- The repository containing transformation and reporting logic
- Query history and representative analyses
- Owners, review dates, tests, and known limitations
- Lineage from the metric back to its sources
This is where a data catalog and the dbt/GitHub connections become valuable. The catalog can tell the AI which asset is certified, who owns it, and what feeds it. dbt can expose models, tests, lineage, and Semantic Layer metrics. GitHub can reveal the code, history, review discussion, and recent changes.
Do not dump every table description and every query into the prompt. Give the AI a retrieval path: start with the approved metric, then pull the specific definition, code, lineage, and examples required for the question.
You are ready to move on when: two people asking the same question get the same metric definition, the AI can show the executable logic behind it, and every answer links back to an owner and source of truth.
The AI now has access, a method, and business meaning. The next problem appears when the answer looks wrong.
4. Let it inspect the entire path behind what the user sees
Suppose someone asks, “Why is revenue wrong on this dashboard?”
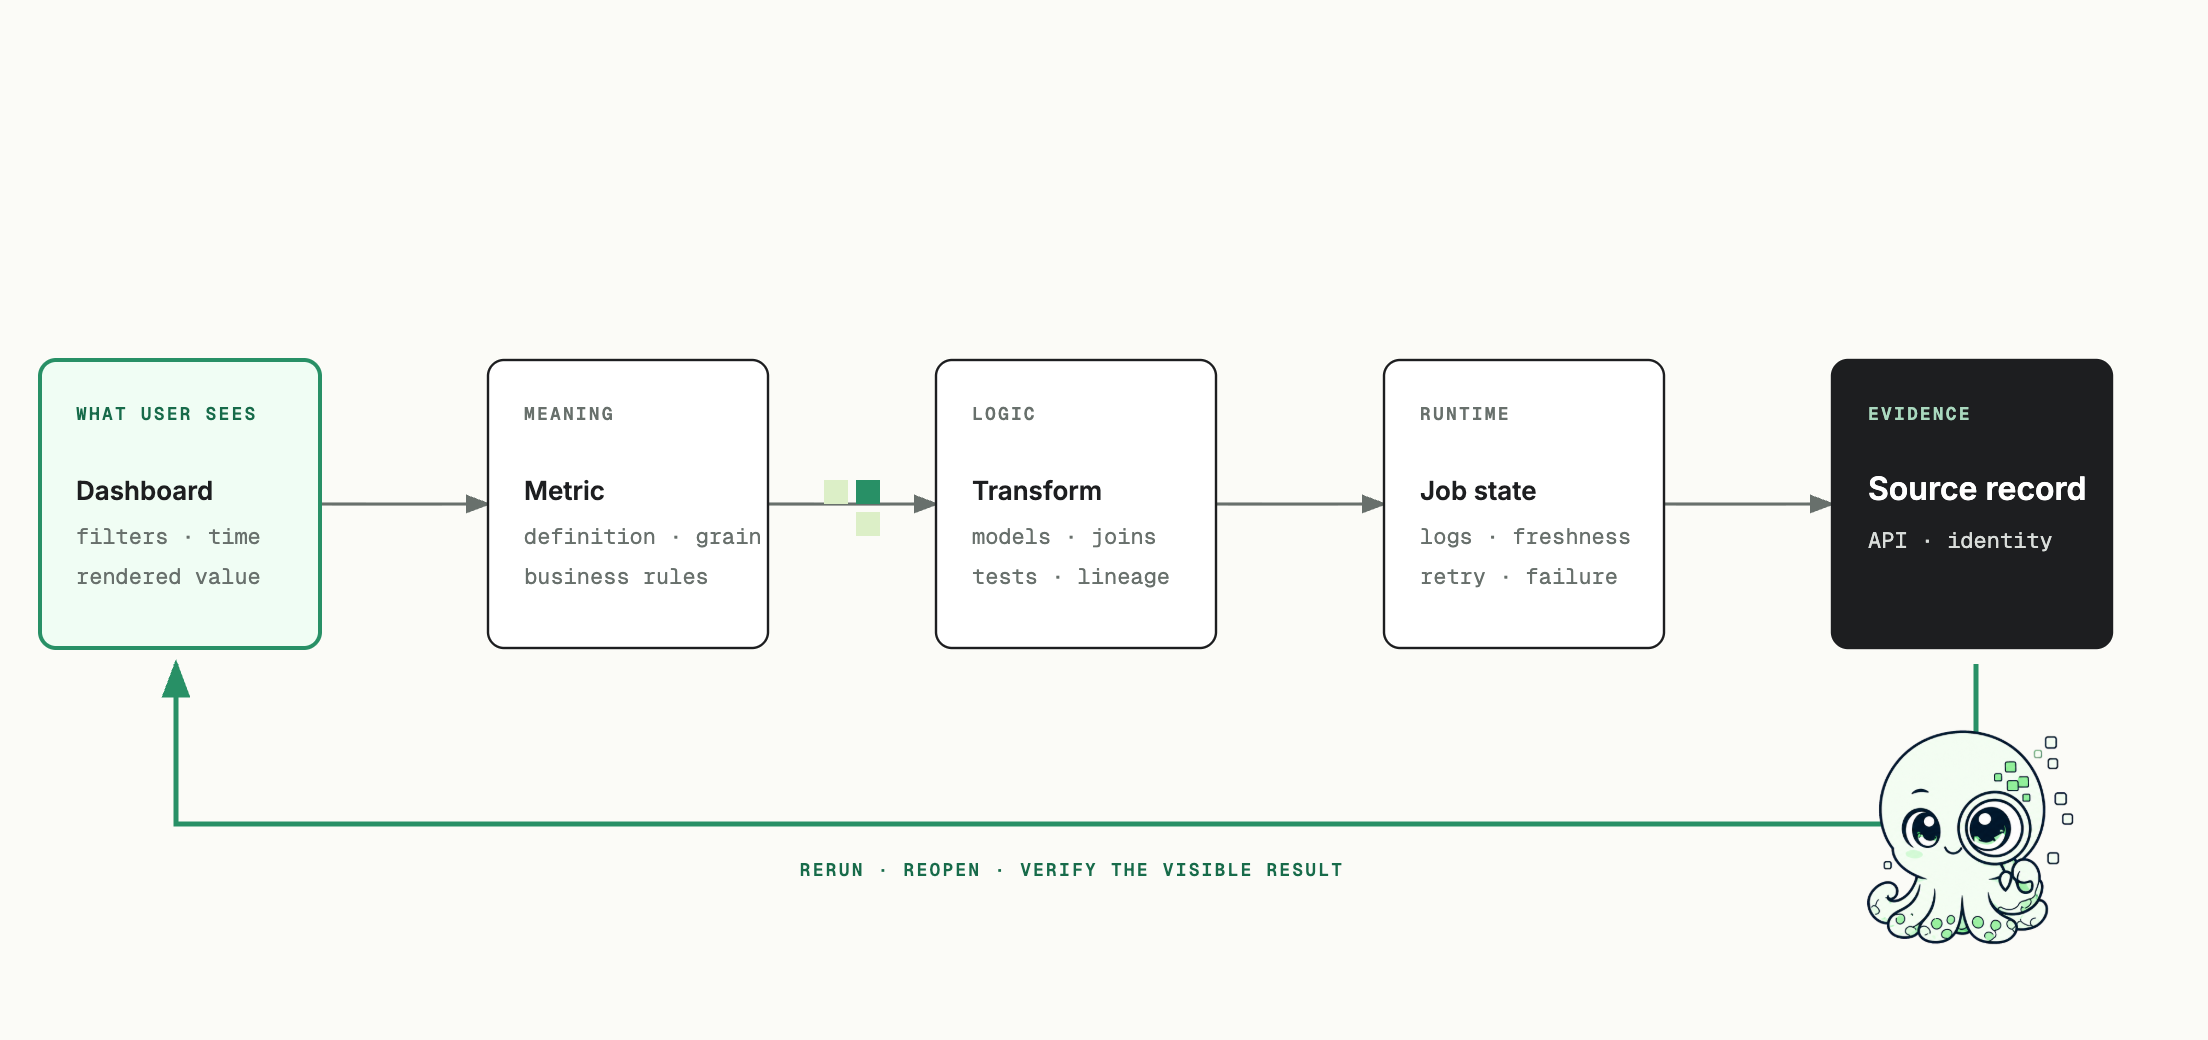
The problem could be the chart. It could be a hidden filter, a different timezone, a changed definition, a many-to-many join, a failed transformation, a late source, or a broken destination. Querying the warehouse is not enough.
The AI needs to traverse the complete production path:
what the user sees
        ↓
dashboard state, filters, timeframe, and rendered values
        ↓
metric definition, semantic model, and business rules
        ↓
queries, models, transformations, tests, and lineage
        ↓
scheduler runs, logs, freshness, retries, and failures
        ↓
source records, source APIs, and identity behavior
This is why the BI, code, catalog, scheduler, and source connections must work together. The AI should be able to begin with the exact filtered report a person is viewing, find the calculation behind the visible number, locate the transformation that produced it, check whether the latest job succeeded, and inspect the records that contributed to the result.
The path also needs to work in reverse. If the AI changes a transformation, it should be able to rerun the work, reopen the report, observe the new value, and compare it with the source evidence.
That is the difference between generating SQL and debugging a data outcome. One produces an artifact. The other can determine whether the artifact fixed the thing a person cared about.
OpenAI describes a similar layered approach in its in-house data agent: company knowledge, metadata, lineage, code-level definitions, runtime data, and iterative investigation are combined rather than treated as separate prompts.
You are ready to move on when: the AI can explain a visible number from dashboard to source, identify the exact broken layer, and verify a repair in the report—not merely confirm that a query ran.
5. Give it reusable business structure, not only dependent SQL
More connected tools
The AI gains surfaces but still reconstructs meaning and responsibility.
A complete operating system
Context, evidence, work, verification, and escalation reinforce one another.
Better access and lineage eventually hit a structural limit.
If a business concept is buried across thousands of lines of staging models, intermediate models, marts, copied queries, and dashboard calculations, the AI can try to reconstruct the meaning every time. But reconstructing is expensive, inconsistent, and difficult to verify.
The system needs a grammar for the business.
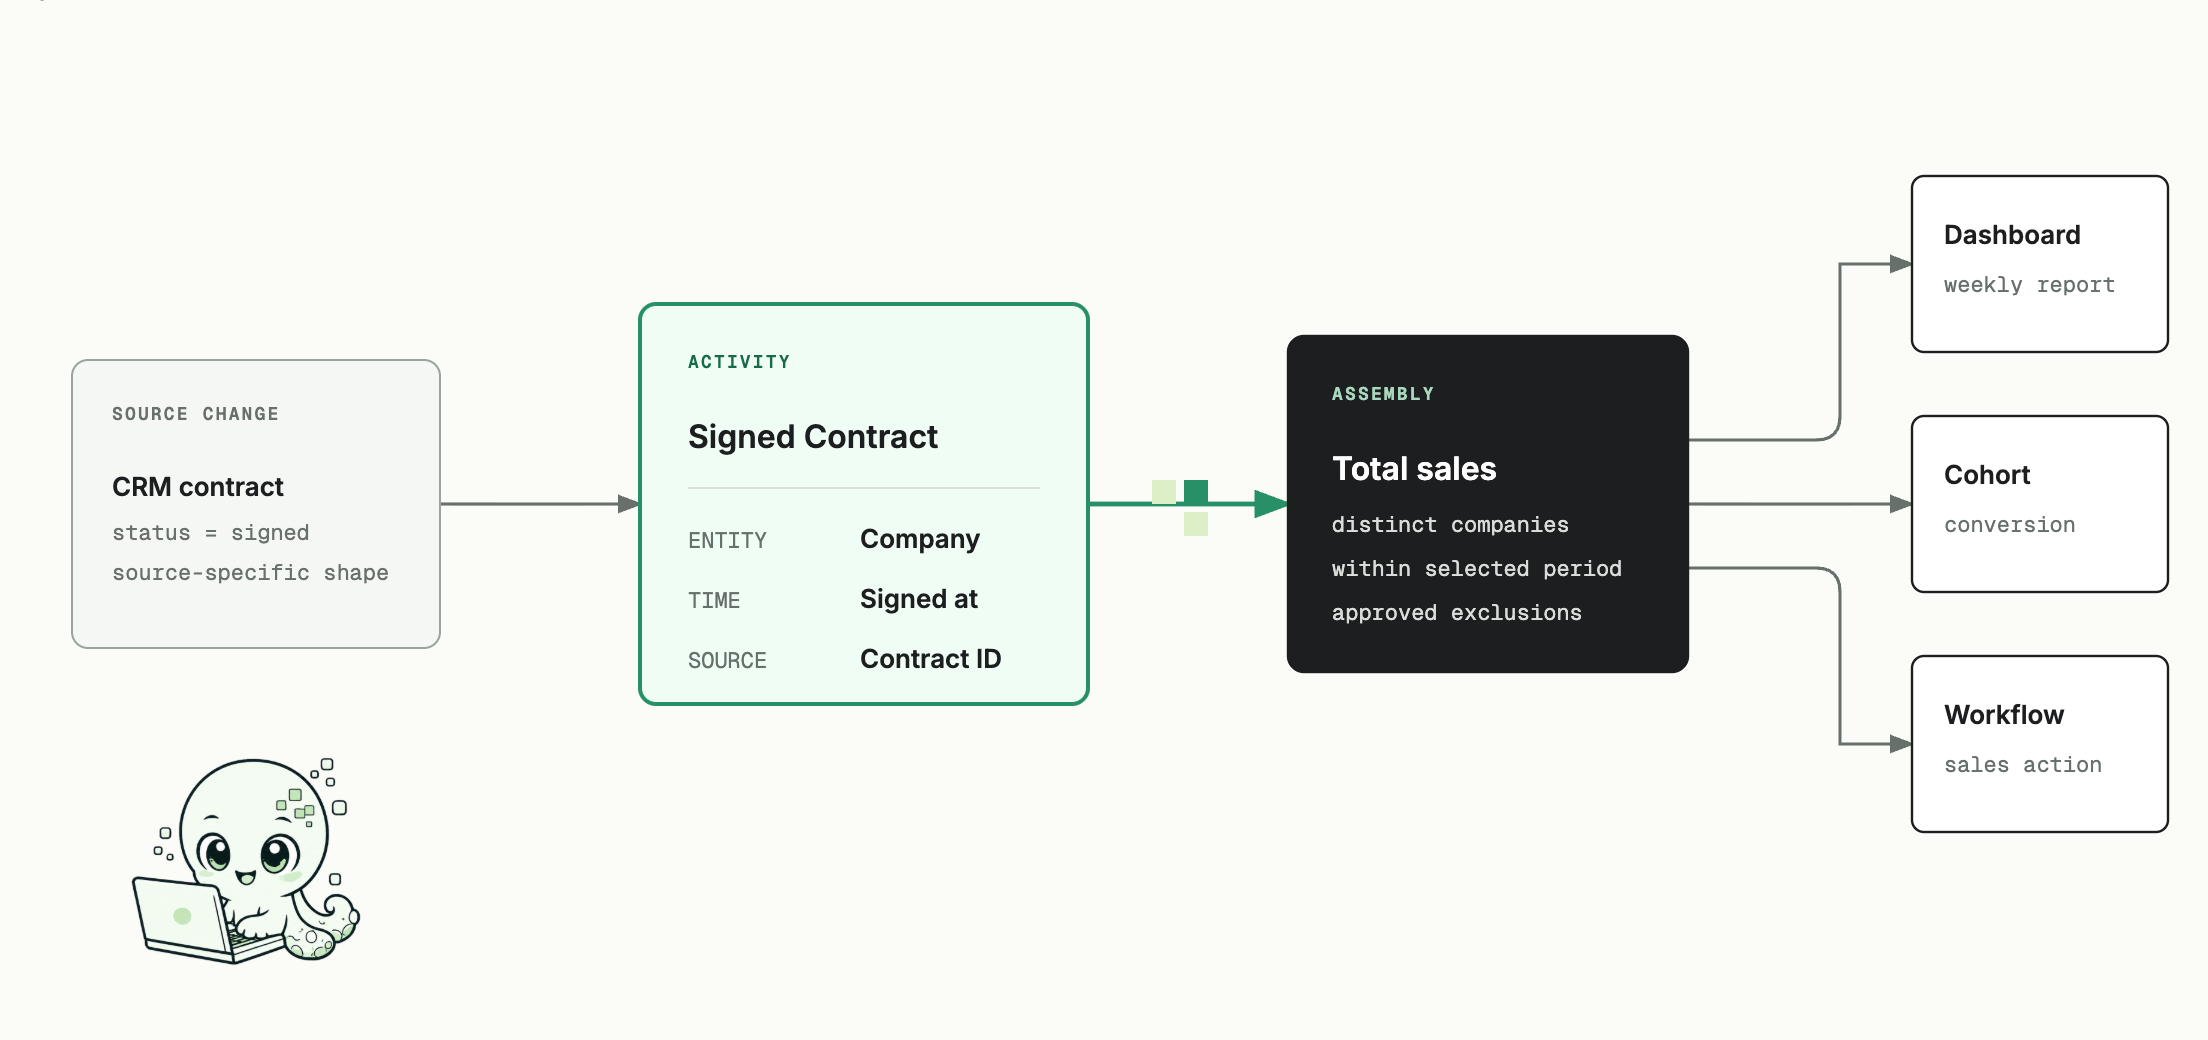
This is why I recommend an Activity Schema. An activity is a governed record of something that happened to an entity:
entity: company_123
activity: Signed Contract
timestamp: 2026-08-12 14:36:00 ET
attributes: plan=enterprise, owner=maya, amount=120000
source: crm.contract_example
Activities turn source-specific changes into business building blocks people can name:
- Visited Pricing
- Completed Sales Call
- Signed Contract
- Started Subscription
- Paid Invoice
- Used Key Feature
- Cancelled Subscription
The AI can then assemble those activities into metrics and analyses. An assembly specifies which entities and activities to include, how identities connect, which time relationship applies, and what grain the result should have.
For example:
Metric: Pricing-to-contract conversion
Start activity: Visited Pricing
Conversion activity: Signed Contract
Entity: company
Window: within 30 days
Grain: one eligible journey per company per quarter
Now the standard workflow becomes:
source data
  → build or reuse an activity
  → assemble activities into a metric
  → use that metric in a dashboard, analysis, presentation, or workflow
The AI still uses SQL, but it no longer has to rediscover the business by parsing every dependent query. It knows what an activity is, how an assembly works, and which governed building blocks represent the outcome.
You are ready to move on when: an important metric can be explained in business activities, the AI can reuse those activities across multiple outputs, and it does not need to reverse-engineer the same concept from raw SQL on every request.
6. Give it examples it can follow end to end
Definitions describe what should happen. Examples show what actually happened.
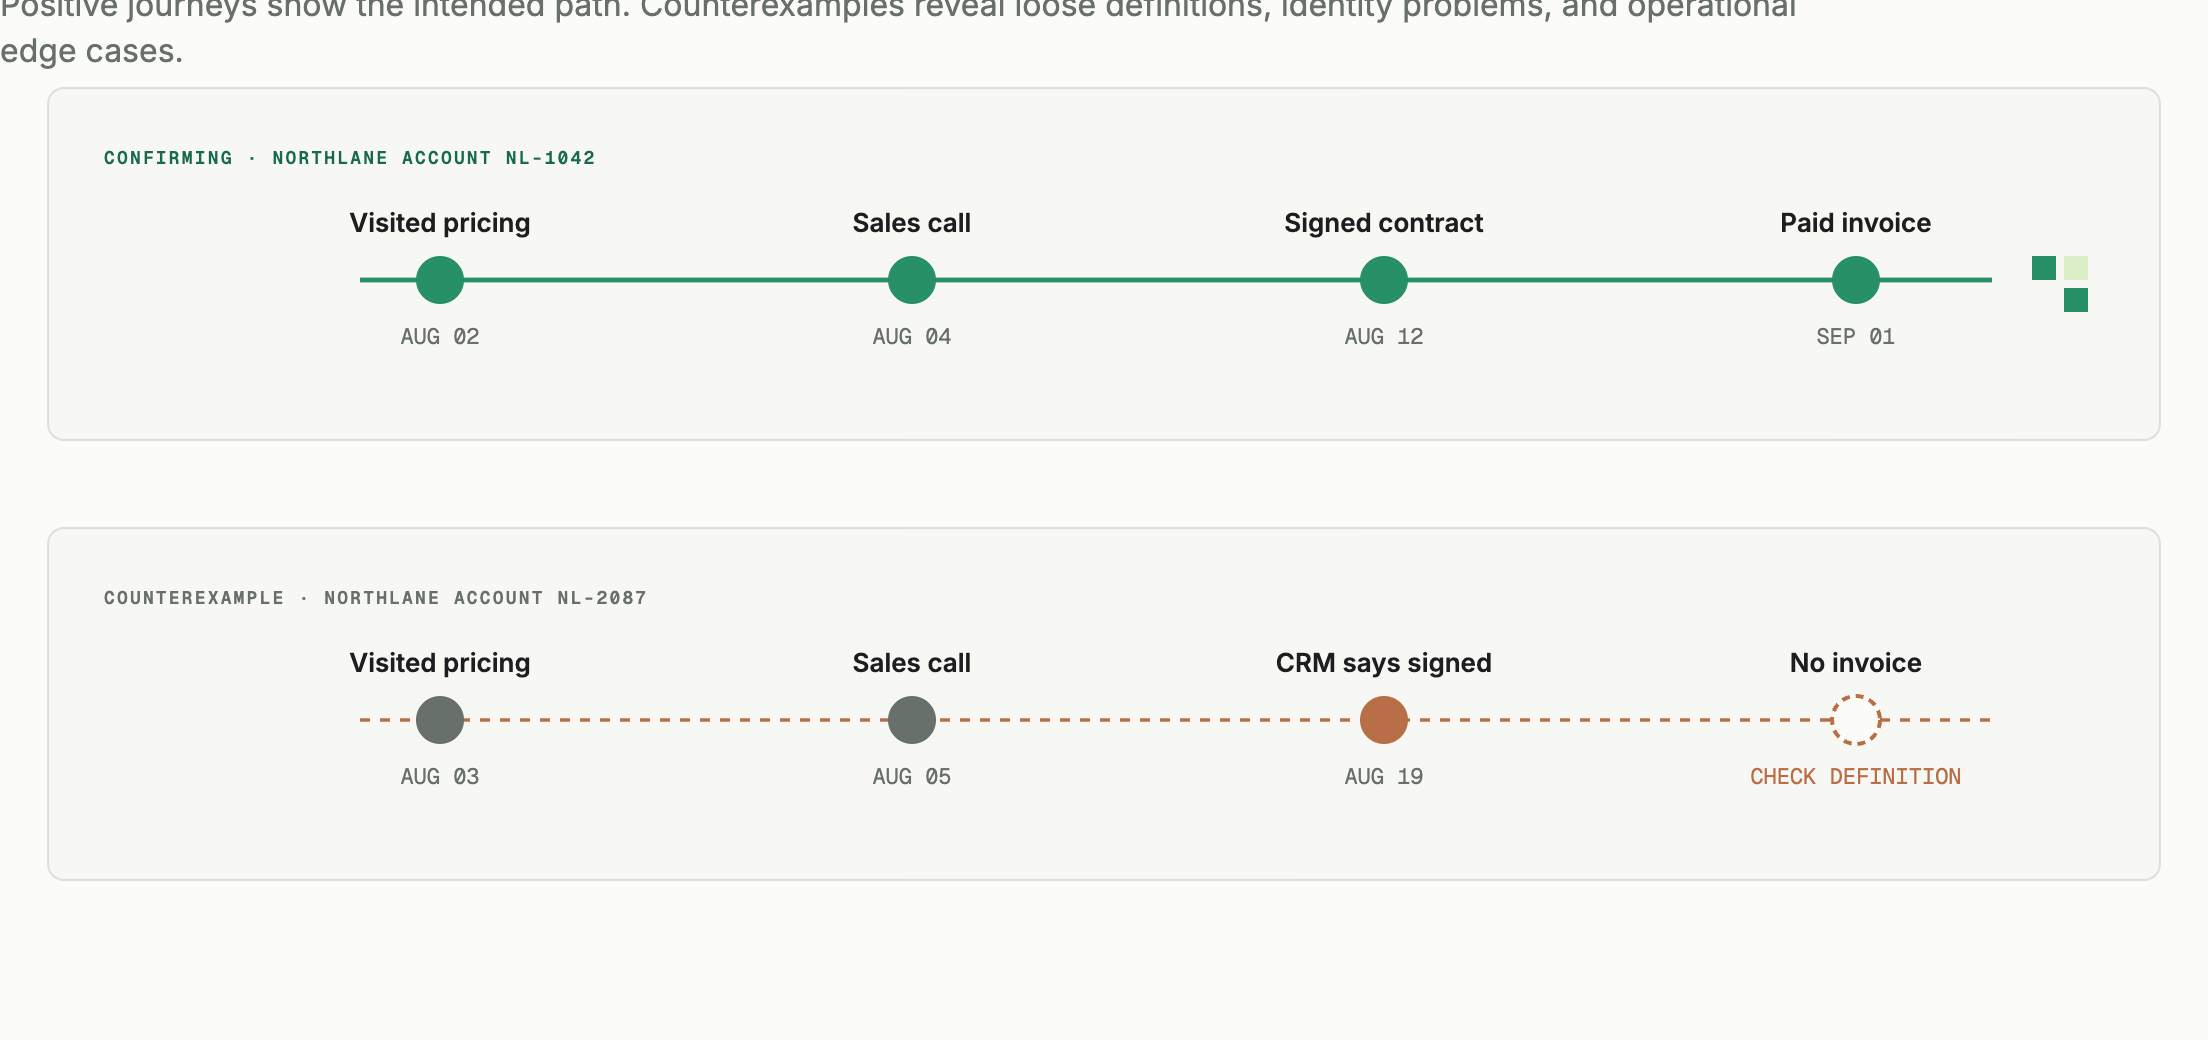
If a funnel says that 42 percent of qualified opportunities became customers, the AI should be able to inspect the real journeys behind that aggregate:
Northlane account NL-1042
Aug 2   Visited Pricing
Aug 4   Completed Sales Call
Aug 12  Signed Contract
Sep 1   Paid First Invoice
It should also find counterexamples:
Northlane account NL-2087
Aug 3   Visited Pricing
Aug 5   Completed Sales Call
Aug 19  Contract marked signed in the CRM
        No signed document found
        No subscription start
        No invoice
That journey might reveal a CRM process issue, an identity-resolution error, a loose metric definition, or a legitimate edge case. An aggregate alone cannot tell you which.
Examples also improve causal humility. Instead of asserting, “Conversion fell because enterprise leads declined,” the AI can identify the segment change, show representative journeys, surface exceptions, and explain what evidence would be needed to distinguish causation from correlation.
Create a small, governed example set for each important metric:
- Normal positive examples
- Normal negative examples
- Boundary cases
- Known data-quality failures
- Recently repaired cases
- High-value or high-risk customers that deserve manual review
Examples should be permission-aware and safe to show. Their value comes from being traceable, not from exposing more data than the person needs.
You are ready to move on when: the AI can take an aggregate conclusion, identify the exact records behind it, follow those records across the full system, and show both confirming and contradicting cases.
7. Connect the data to meetings, decisions, and tasks
The meaning of a number often lives partly in what the company is doing.
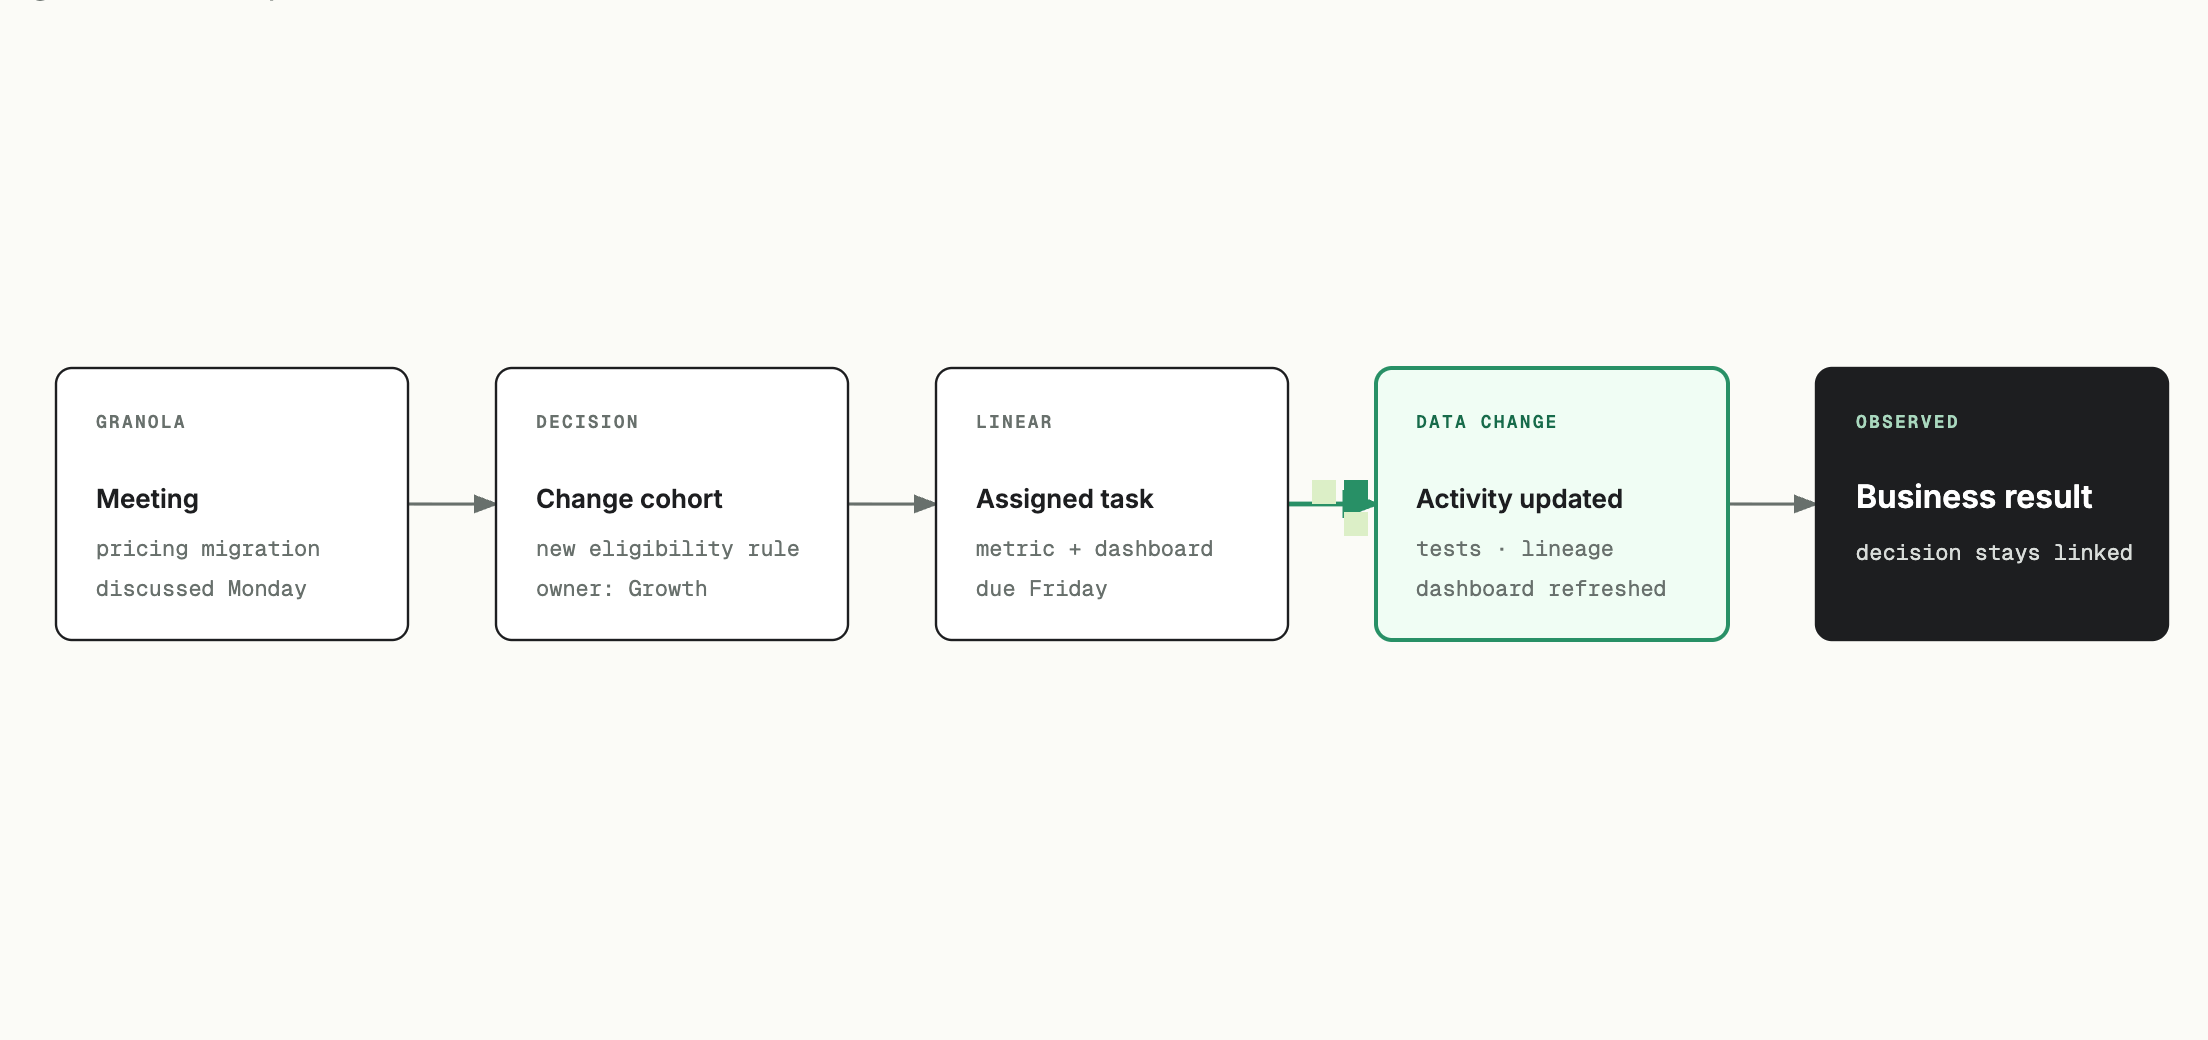
A retention drop could be a bug. It could also be the expected effect of a pricing migration discussed last week. A change in lead volume could be a broken integration or the result of a campaign the marketing team intentionally paused.
The AI should know:
- What the team worked on in the past
- What is being investigated now
- What is planned next
- What changed in recent meetings
- Which decisions have already been made
- Which owners and deadlines are attached to the work
Connect project systems such as Linear and meeting systems such as Granola, or the equivalents your team already uses. Preserve the relationships among the artifacts:
meeting discussion
  → decision
  → task
  → model, activity, metric, dashboard, or workflow change
  → observed business result
The specific tools matter less than the connections. A meeting note should link to the decision it records. The decision should link to the task. The task should link to the data asset being changed. The changed result should link back to the report where the question began.
Keep this context permission-aware. The AI should not become an omniscient company memory that bypasses source permissions. It should retrieve only the meeting and task context that the person and the work are allowed to use.
You are ready to move on when: the AI can explain why a metric matters now, distinguish a failure from an intentional change, and connect an analysis to the decision, owner, and next task.
8. Let it act through workflows and APIs
Analysis becomes valuable when it changes what the company does.
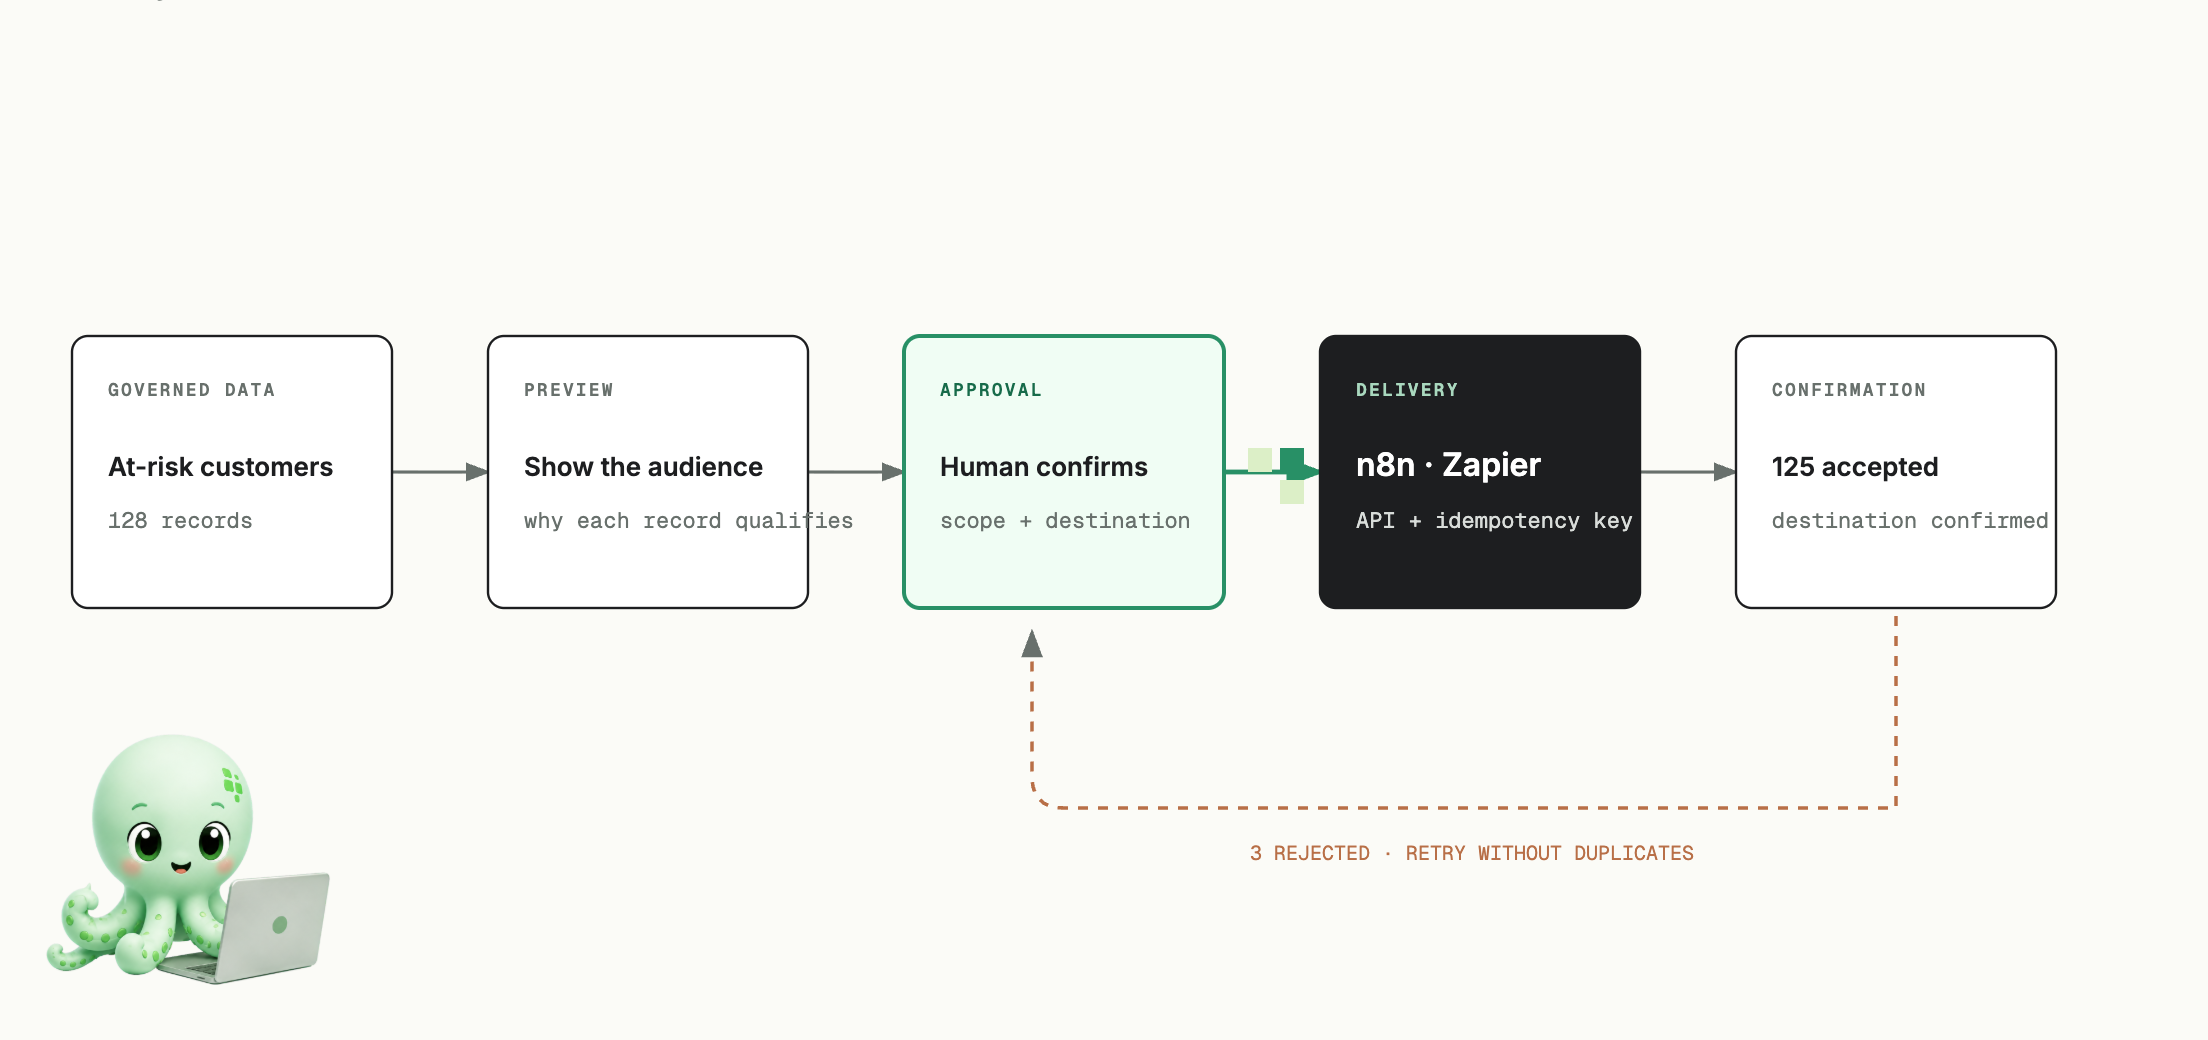
The AI might need to:
- Send qualified accounts to a sales system
- Alert customer success when an important behavior stops
- Enrich a record through an external API
- Generate and distribute a recurring report
- Update a planning model
- Trigger a reprocessing job
- Create a follow-up task with the supporting evidence
Zapier MCP and n8n’s built-in MCP server are practical ways to give an agent access to workflow systems. n8n can let an agent build and run workflows inside the company’s own instance. Zapier can expose actions across a broad application ecosystem. You can also connect directly to the APIs that matter for your business.
But “the tool call succeeded” is not a business outcome. The complete action path is:
governed source data
  → approved audience or decision
  → workflow trigger
  → destination API
  → delivery result
  → confirmation, retry, repair, or escalation
If the AI sends 5,000 rows, it needs to know how many the destination accepted, which failed, whether a retry created duplicates, and whether the expected records appeared in the destination.
Start with bounded actions. Use the minimum permissions required. Add previews, approvals for consequential changes, idempotency keys, rate limits, logs, and recoverable failure paths. Separate the ability to propose a workflow from the ability to activate it in production.
You are ready to move on when: the AI can preview an action, execute it with the right permission, observe the destination state, and account for every success, rejection, and retry.
9. Close the loop around the outcome
This is where the pieces become a system.
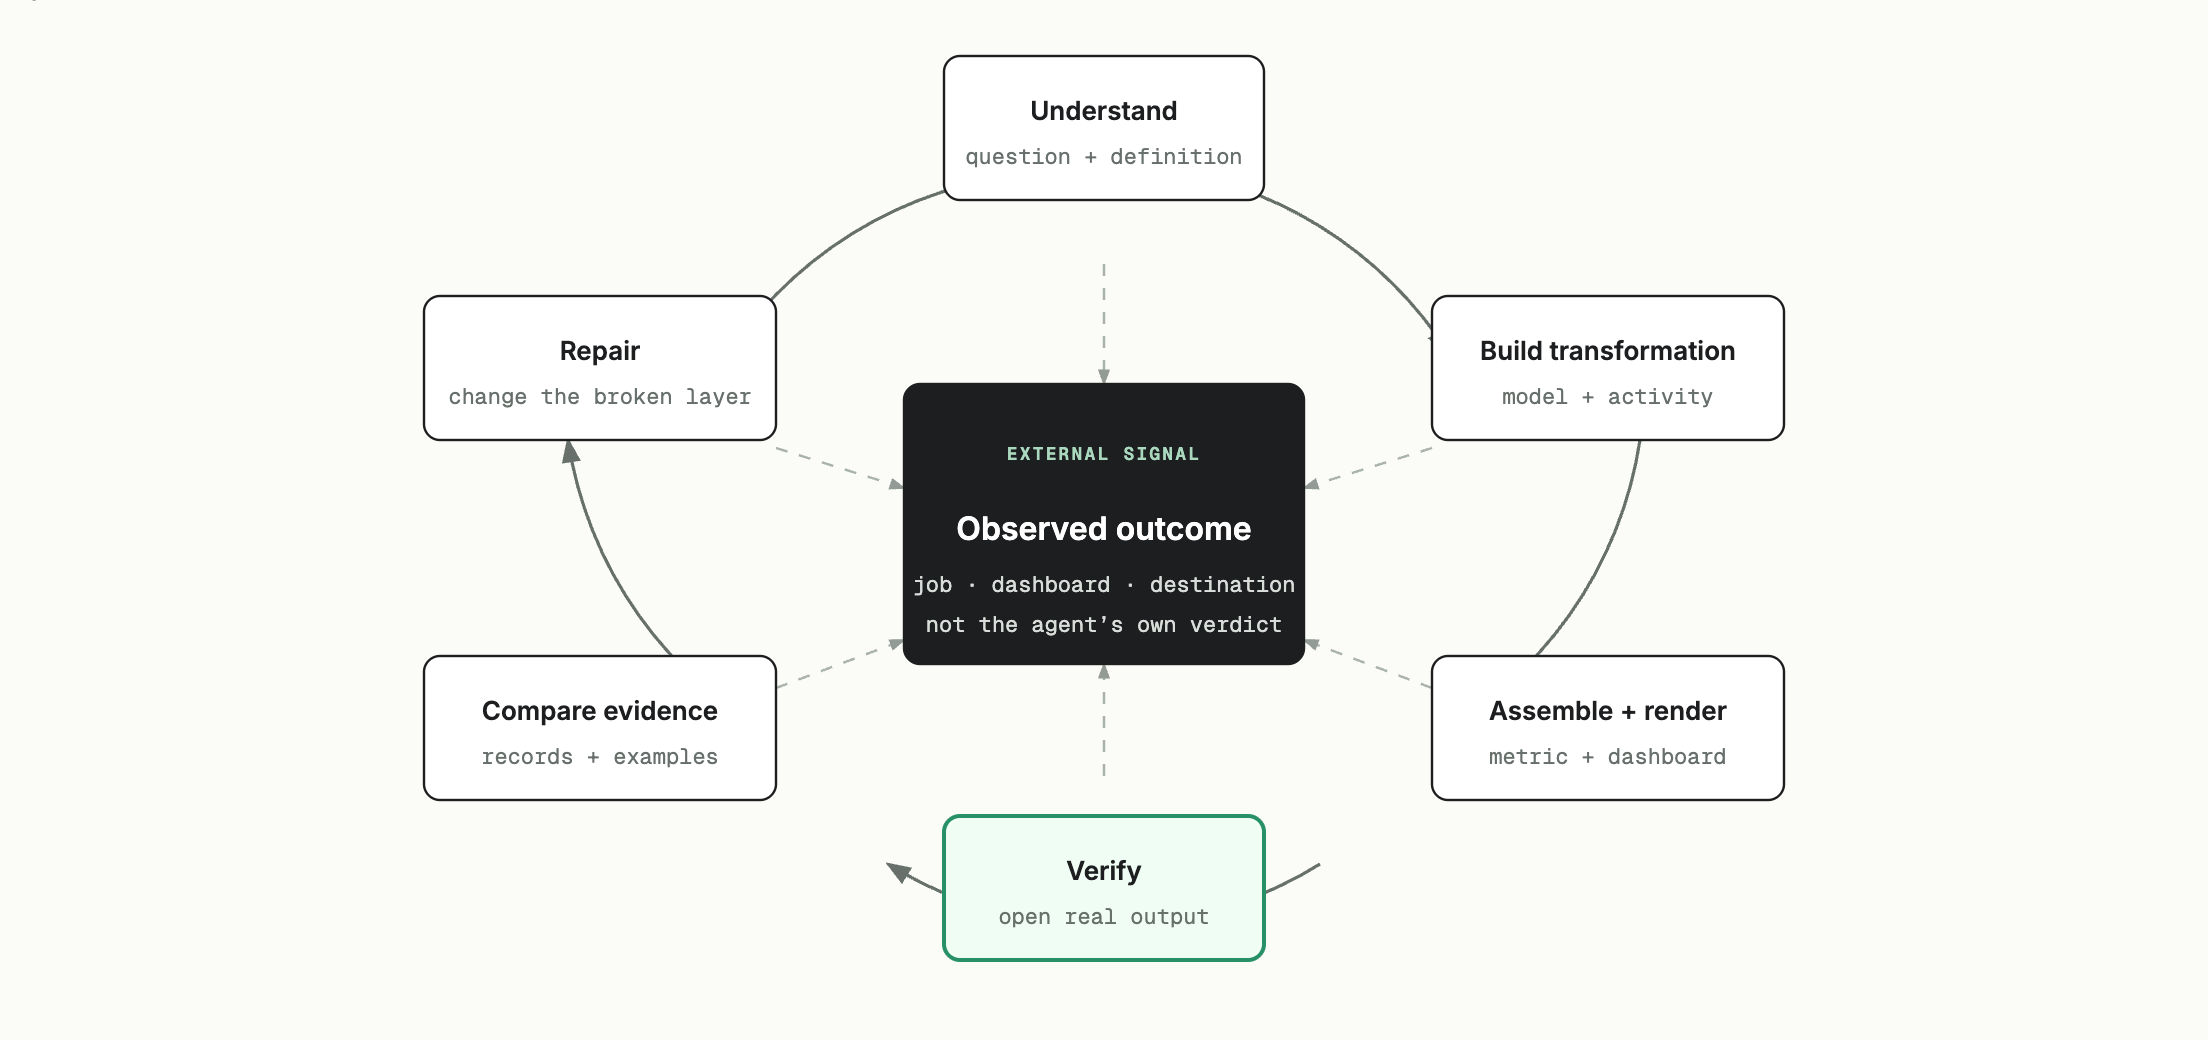
The foundational ReAct paper showed why reasoning and action work better when they are interleaved: the agent acts on an external environment, observes what happened, and updates its plan. For data work, that loop should operate across the whole production path—not stop after generating SQL.
For a request like “Build a trusted conversion dashboard,” the loop should look like this:
- Understand the decision the dashboard should support.
- Retrieve the analytical method and approved definitions.
- Inspect the existing reports, queries, lineage, jobs, and examples.
- Build or repair the transformation.
- Build or reuse the required activities.
- Assemble the metric from those activities.
- Build or update the dashboard.
- Run the transformation and its tests.
- Open the dashboard in the state the user will consume.
- Compare the visible result with source records and example journeys.
- If something is wrong, trace the failure, repair it, rerun it, and inspect again.
- Publish the result, trigger the approved action, or escalate the unresolved judgment.
understand
  → build
  → run
  → observe the real output
  → compare with definitions and examples
  → repair
  → repeat until verified
The verifier cannot simply be the same AI saying, “This looks right.” A recent paper on long-running agent loops, When Do Agent Loops Mistake Stagnation for Progress?, found that self-evaluation can accept plausible-looking changes even when real-world performance does not improve. The success signal has to come from outside the transcript: the actual job state, rendered dashboard, destination record, reconciliation, or human review.
This is why the place where the user consumes the data should be part of the same observable loop the AI uses to debug it. If a person sees a dashboard but the AI only sees a warehouse query, both can be “right” about different things. The AI must be able to inspect the final experience.
OpenAI’s internal data agent describes the same practical pattern: layer the context, inspect intermediate results, adjust the approach when they look wrong, and evaluate the agent on real end-to-end data tasks rather than isolated query generation (OpenAI).
You are ready to move on when: the AI can build a change, execute it, observe the same output the user sees, test it against governed definitions and real examples, and continue until the outcome—not merely the code—is correct.
10. Give the AI somewhere to escalate
Even a well-designed loop reaches questions it should not answer alone.
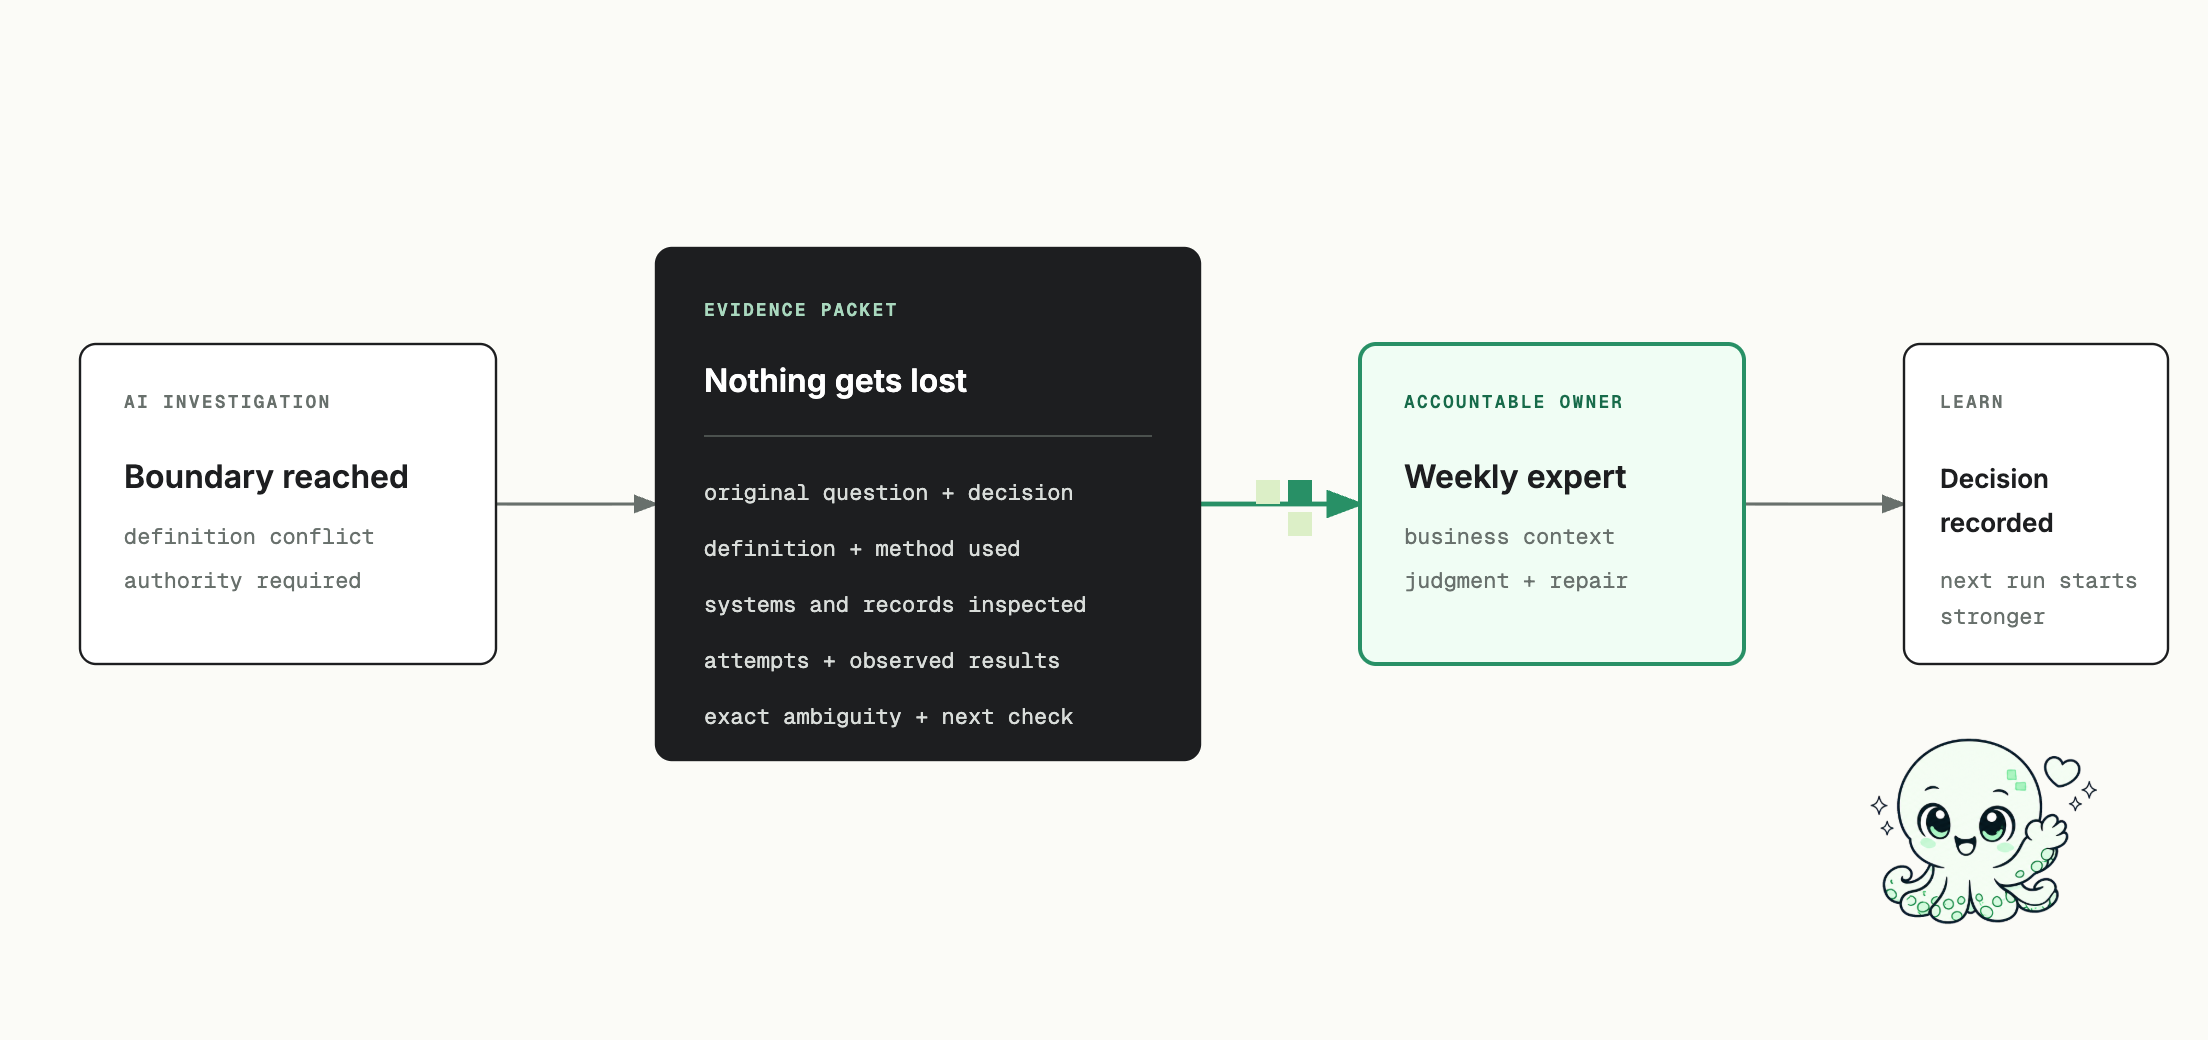
Two leaders may want different definitions. A source may change in a way the system has never seen. The technically correct answer may have a consequence that requires judgment. The AI may have enough evidence to identify the ambiguity but not enough authority to resolve it.
At that point, it should not guess, stall, or quietly hand the problem back to the person who asked. It should escalate to an expert who understands the business and can do the work.
A good escalation includes:
- The original question and intended decision
- The method and definition used
- The reports, models, jobs, and examples inspected
- What the AI tried and what happened
- The exact ambiguity or failure
- The affected outputs, workflows, and people
- Its recommended next check or decision
The expert should inspect the same evidence, resolve the ambiguity, repair the system, and record the decision in the graph of definitions, work, and outputs. The next question should start from the stronger system rather than repeat the same investigation.
You are ready when: the AI knows the boundary of its knowledge, packages the evidence without losing context, and routes the problem to a named person who is accountable for resolving it.
Why connecting all the tools still was not enough for us
To be completely transparent, we built this stack step by step.
We gave AI access to the data. We created instructions for how it should think. We added definitions, models, dashboards, tasks, meetings, workflows, customer journeys, and activation. We gave it ways to inspect failures and retry work.
Every layer improved the result.
But it still needed more.
The AI had access to many systems without having a durable map of how everything related. It had to retrieve enormous amounts of context and repeatedly reconstruct the business. It could read SQL, but there was no guarantee it would use the same standard workflow every time. The person consumed a report in one place while the AI debugged fragments of it across several others. And when judgment was required, the expert often had to rebuild the context from scratch.
That led us to build four things into one system at Polyform.
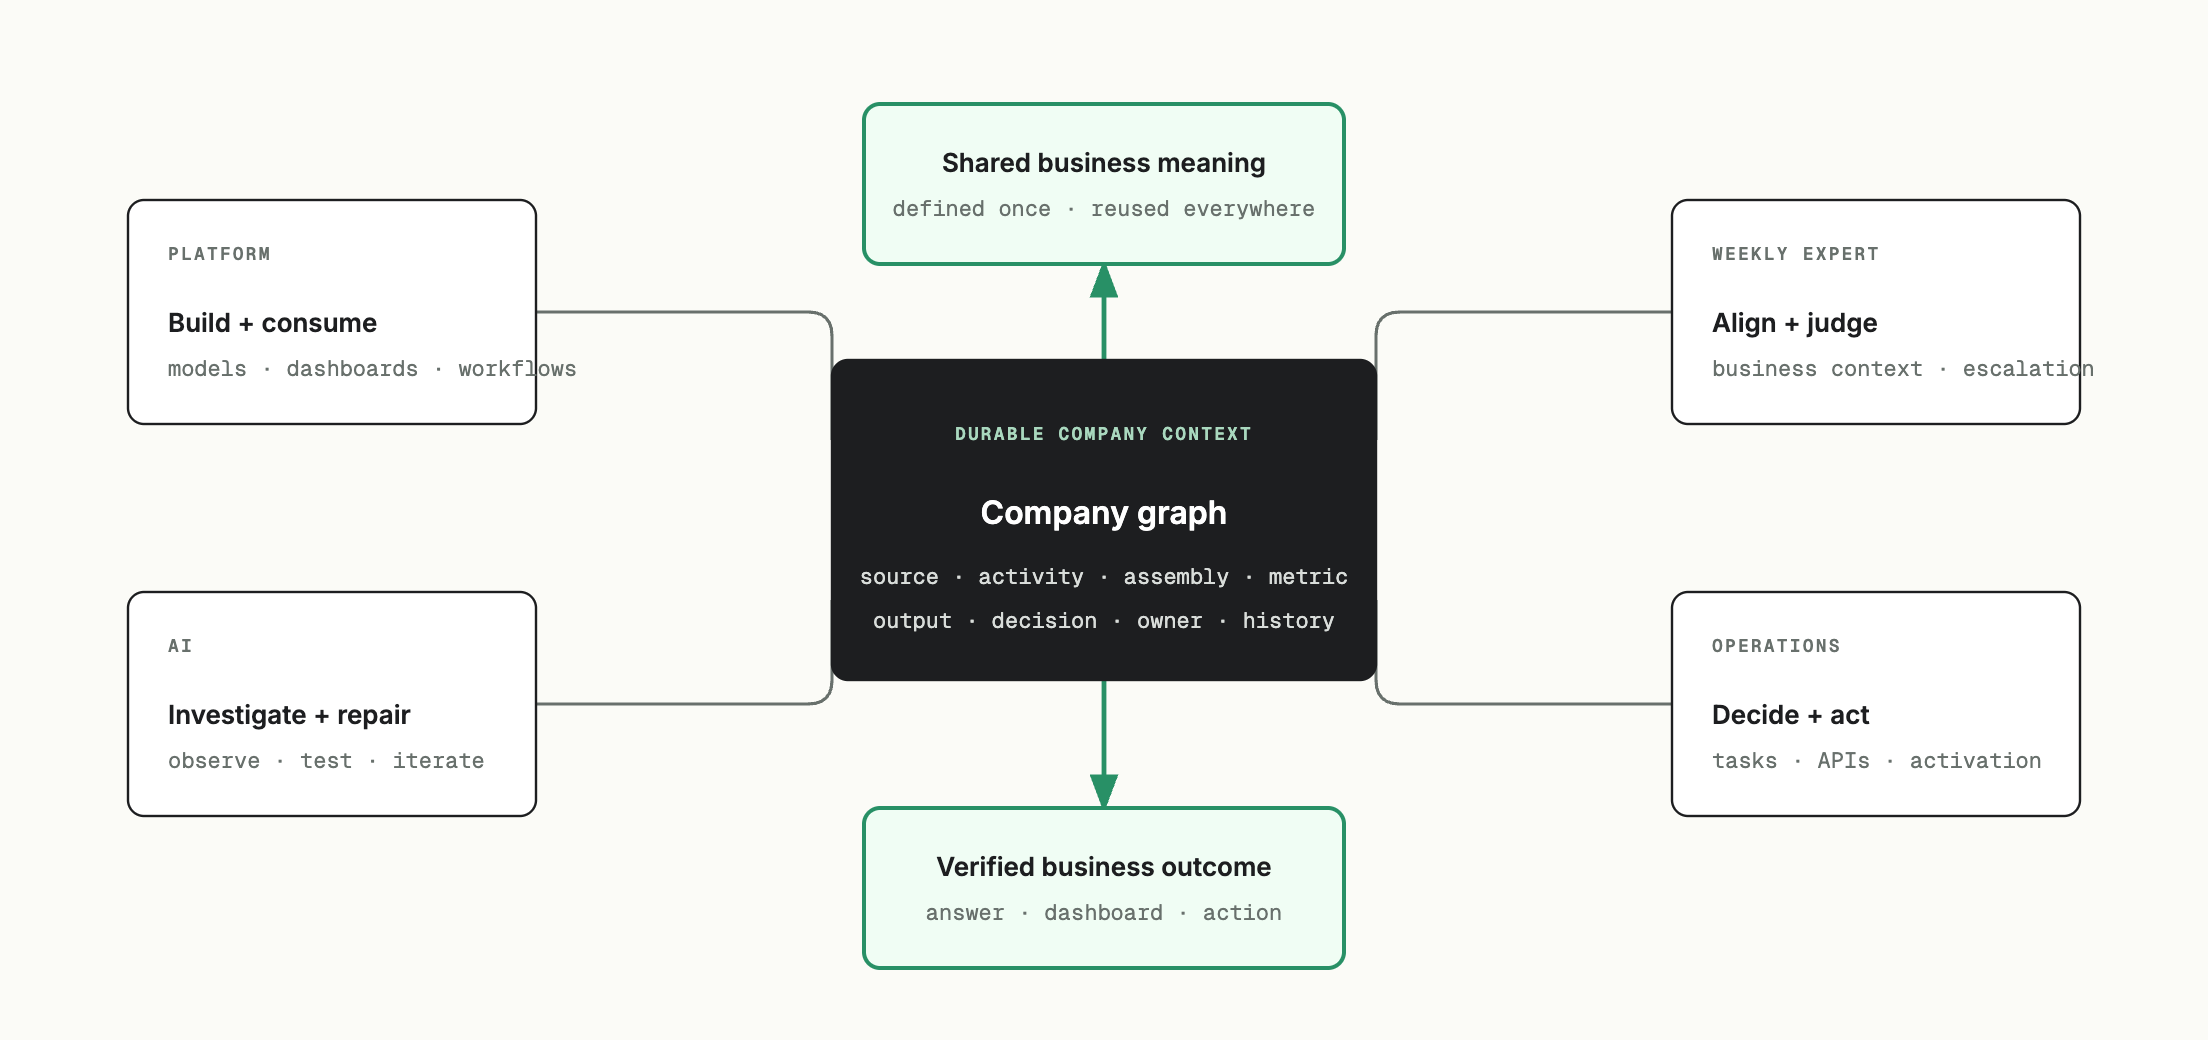
1. A graph of how the company’s data work relates
The system preserves the relationships among sources, activities, definitions, models, reports, presentations, customer journeys, tasks, meeting decisions, workflows, owners, and experts.
That graph is not just a search index. It tells the AI how one change affects the rest of the system. If a definition changes, it can find the dashboards, cohorts, presentations, workflows, and decisions that depend on it. If a task came from a meeting, it can preserve why the work was requested and what outcome was expected.
2. A standard grammar and workflow for data
Activity Schema gives the AI reusable business events and assemblies. Instead of parsing thousands of lines of SQL to rediscover what “signed,” “activated,” or “retained” means, it can use governed activities to build metrics, cohorts, journeys, dashboards, and workflows.
The standard loop becomes understandable to both a person and an agent:
build the transformation
  → create or reuse the activity
  → assemble the metric
  → build the output
  → inspect the output
  → test against source records and examples
  → repair or publish
3. One operating environment for consumption and debugging
We brought data processing, modeling, exploration, dashboards, PowerPoint creation, cohort analysis, customer journeys, tasks, meetings, workflows, APIs, and activation into the same connected environment.
That matters because the AI can inspect the place where the person experiences the result. It can build a dashboard, see the dashboard, test the number, trace the records, repair the underlying activity, rerun the work, and return to the same dashboard to confirm the change.
The loop closes around the user’s outcome rather than around one tool’s output.
4. An expert who keeps the system aligned with the business
Polyform includes a dedicated data expert who works with the customer every week. Your team remains the expert in your business. Our expert learns that context, turns it into governed definitions and activities, keeps the graph current, reviews consequential work, and resolves the cases the AI should escalate.
The human is not an emergency fallback added after the system fails. The expert is part of how the system learns what matters and stays trustworthy as the business changes.
The goal is not an AI that knows every tool
The goal is an AI that can finish a business process.
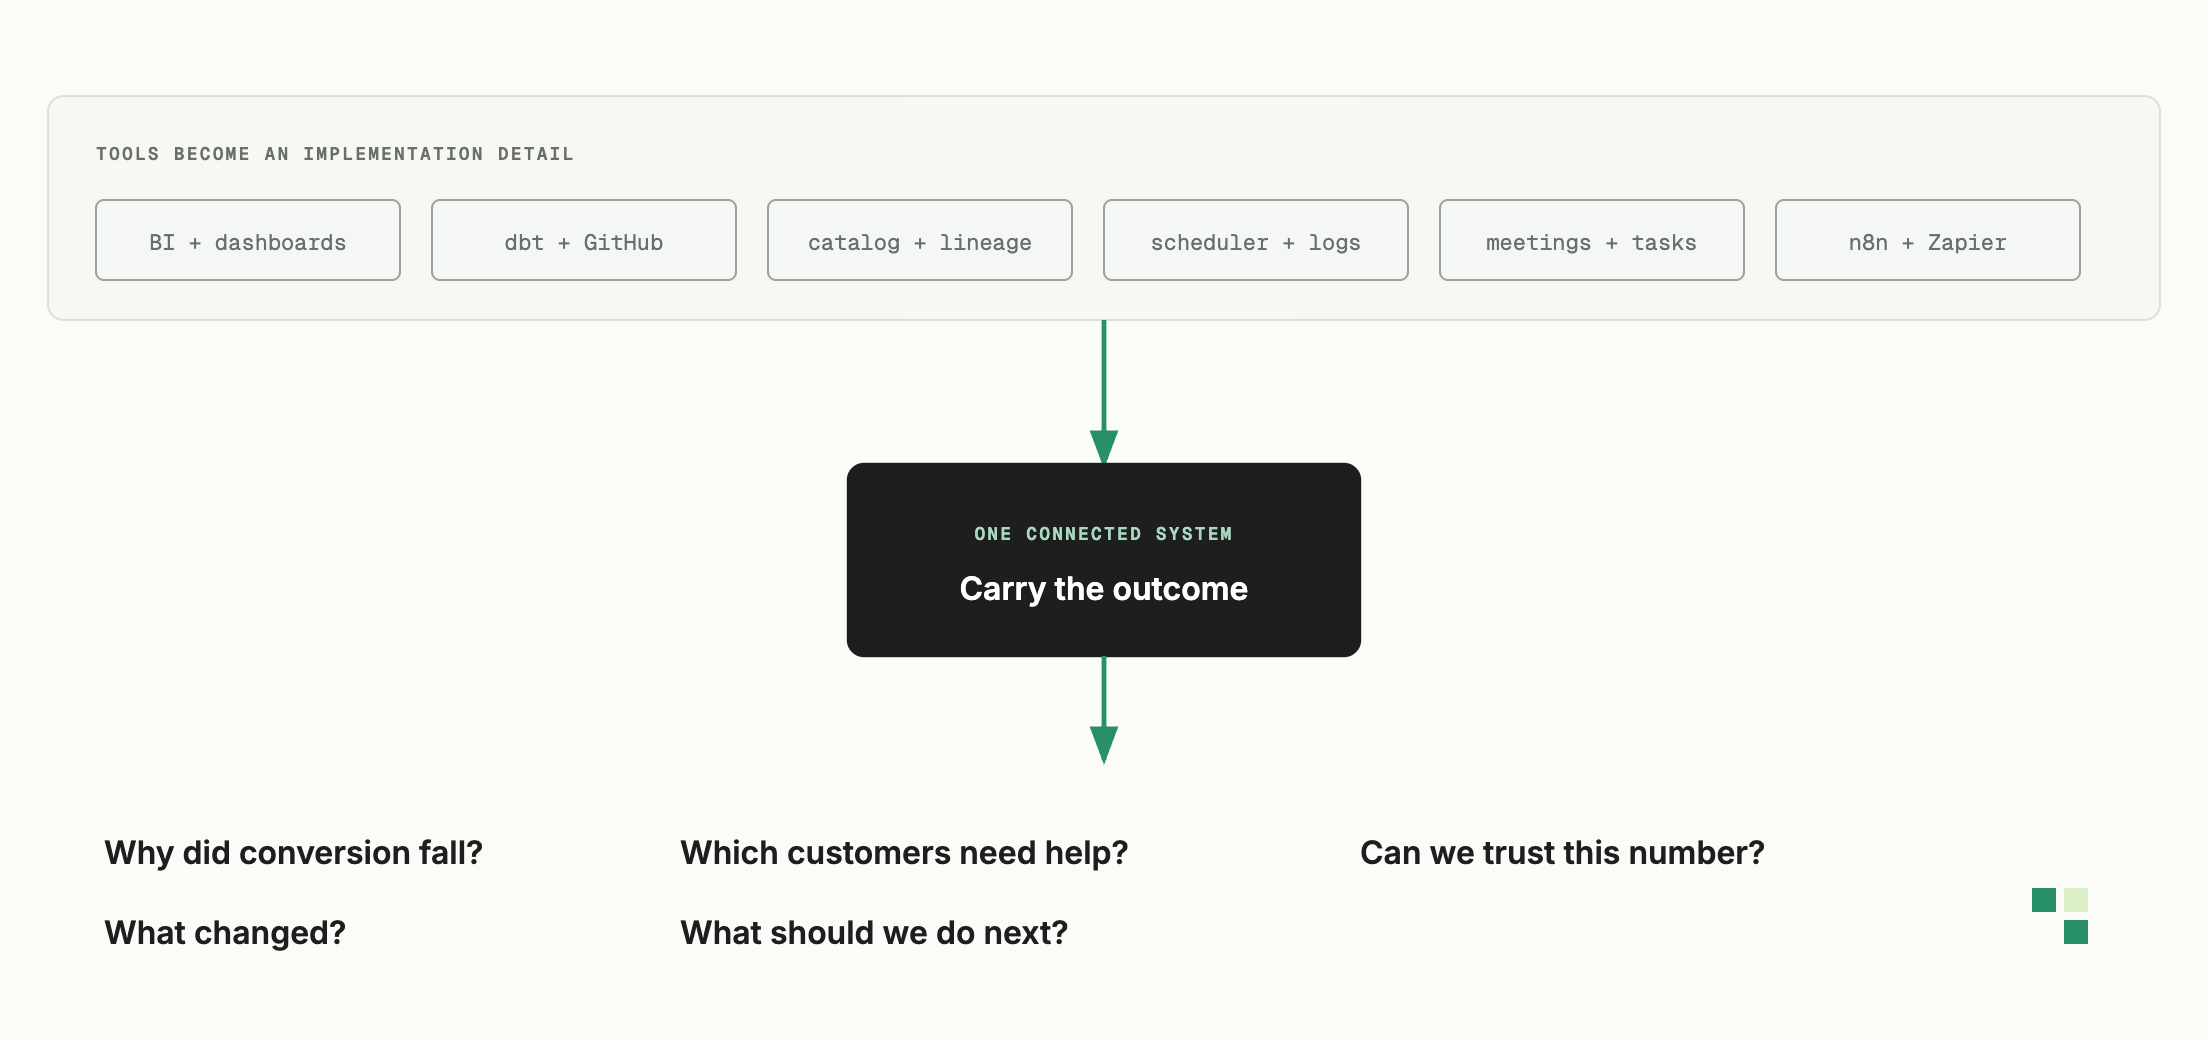
People do not think, “I need an MCP call to Tableau, a dbt model, an Airflow run, and a Zapier action.” They think:
- Why did conversion fall?
- Which customers should we help?
- Is this number trustworthy?
- What changed?
- What should we do next?
The tools are necessary, but they should disappear behind the outcome.
The companies that get the most from AI for data will make their businesses legible to the system: access is deliberate, methodology is explicit, metrics are governed, the full path is observable, examples are traceable, work is connected, actions are verifiable, and judgment has an accountable owner.
The model is already powerful.
Build the system that lets it understand the outcome, carry the work across tools, verify what happened, and finish the job.
Polyform’s Activity Schema approach provides the reusable business grammar in this blueprint while the wider system keeps evidence, execution, and expert escalation connected.
References and further reading
- ThoughtSpot MCP
- Looker-managed MCP
- Tableau MCP
- Power BI MCP
- dbt MCP
- official GitHub MCP server
- Atlan MCP
- DataHub MCP
- OpenMetadata MCP
- Collibra MCP
- Alation Agent Studio and SDK
- Airflow’s public API
- Prefect MCP
- Kestra’s AI tools
- in-house data agent
- Activity Schema
- Linear
- Granola
- Zapier MCP
- n8n’s built-in MCP server
- ReAct paper
- When Do Agent Loops Mistake Stagnation for Progress?
- Polyform