What Is the Best AI for BI? Know When Business Intelligence Is Not Enough
ThoughtSpot and Omni can make business intelligence dramatically better. But the answer you need may depend on definitions, models, sources, and work that lives outside BI.

There is no single best AI for business intelligence. The right answer depends on whether you need a faster way to use BI—or a system that can take a data question all the way to a trustworthy result.
If your data is modeled well, your business definitions are clear, and the answer already exists inside your analytics environment, modern AI BI tools can be amazing. They can make it much easier for someone to ask a question, explore a metric, build a chart, and understand what changed.
But I keep seeing companies search for “AI for BI” when what they actually want is the ability to ask any important question and get a correct answer from their data. Those are not always the same problem.
The category boundaryThoughtSpot and Omni make BI much better
I want to start by being fair to the tools in this category. The strongest AI BI products are not simple chat boxes bolted onto dashboards.
ThoughtSpot's Spotter is designed as an analytics agent. ThoughtSpot says it can break questions into steps, test assumptions, rerun analysis, and show the logic behind an answer. It grounds questions in a governed semantic layer and translates them into visible search tokens instead of treating unconstrained text-to-SQL as the entire solution. ThoughtSpot has also expanded the product with agents for modeling, visualization, and code.
Omni's AI experience is grounded in the organization's semantic model—the layer containing metrics, relationships, and business logic. Its agent gives people a conversational way to explore governed data, while the underlying model keeps the answers consistent with the rest of Omni. Omni has also written candidly about how much reliable AI analytics depends on context: what a metric means, how a field should be used, and which rules should apply to a question.
These are valuable products. If the job is to make BI more accessible, conversational, and efficient, I would absolutely look at them.
Use the system
Explore governed data that already exists: ask, filter, explain, visualize, and understand what changed.
Change the system
Create a missing model, reconcile definitions, repair a source, test the change, deploy it, and validate the result.
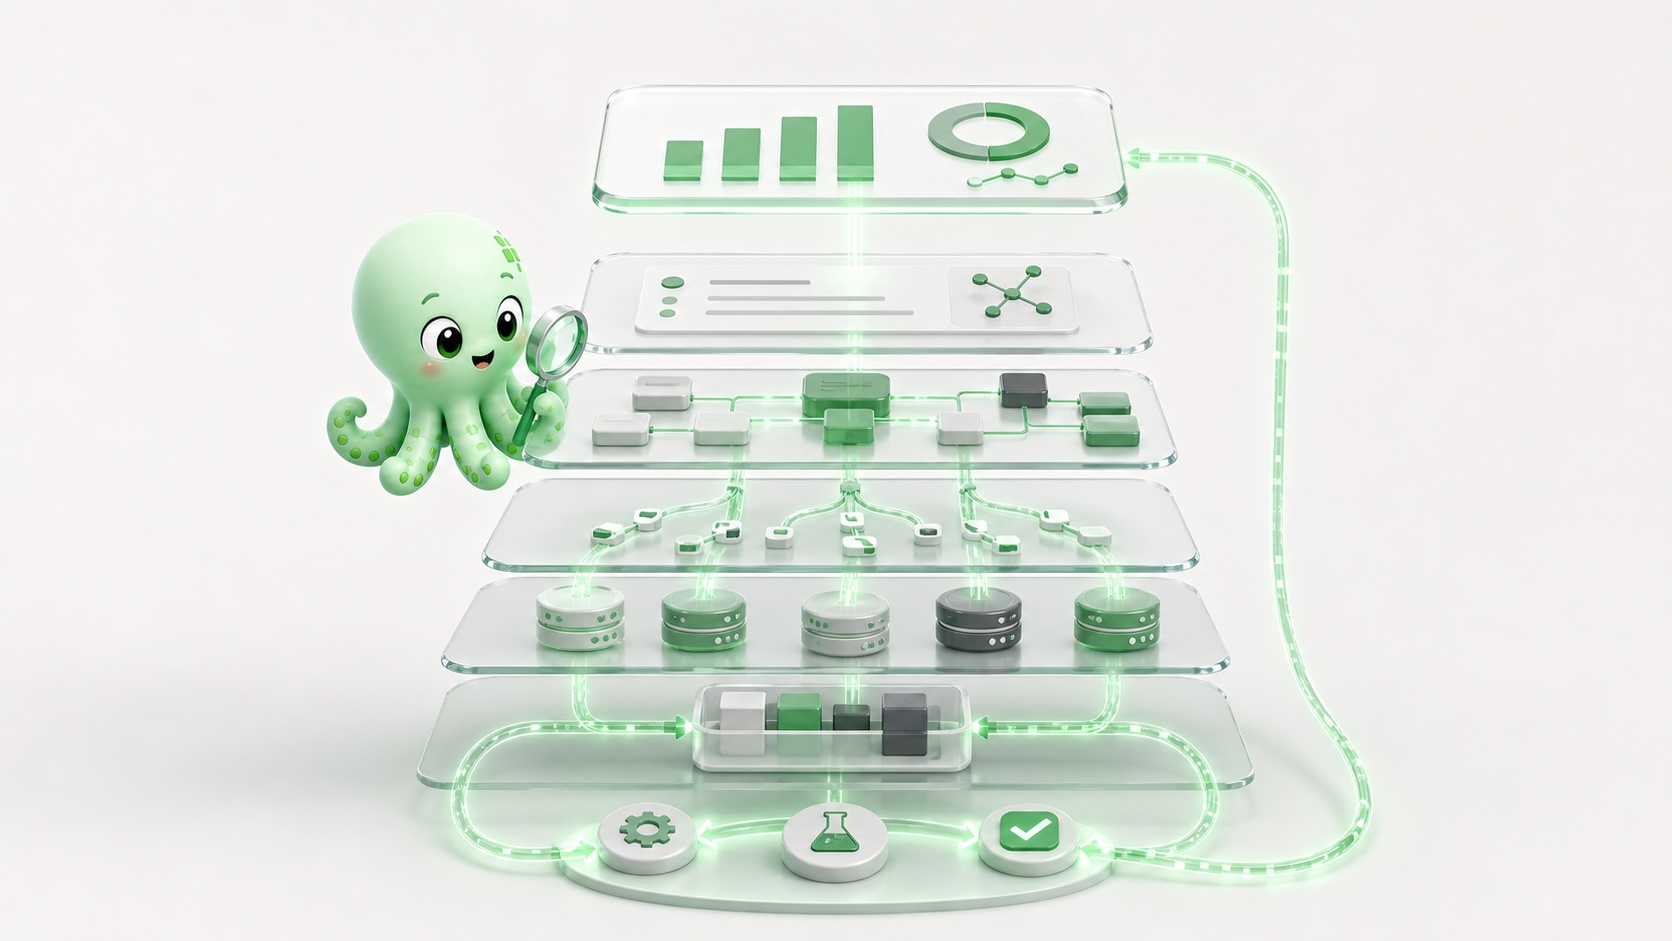
BI is a wrapper around the rest of your data system
A dashboard looks like the place where the answer lives. Usually it is the last visible layer of a much longer chain.
The chart is powered by a metric. The metric depends on a definition. The definition is implemented in a data model or query. That model may depend on many more models and thousands of lines of logic. Those models depend on source systems, ingestion jobs, identity rules, timestamps, and assumptions about how the business works.
A data dictionary helps, but only if it is current, discoverable, and connected to the logic that actually produces the number. A beautifully written definition of “revenue” does not guarantee that the dashboard is using it. Two teams can use the same word while querying different sources, applying different date rules, or treating refunds differently.
AI does not remove that dependency chain. In some cases it makes the chain easier to use. In other cases it answers confidently from whatever layer it can see.
This is why “Which AI BI tool gives the best answers?” is incomplete. A better question is: What has to be true underneath the BI tool for its answer to be trustworthy?
-
01
Visible answerDashboard · chart · AI response
What the user sees
-
02
Business meaningMetric definition · data dictionary
What the number is supposed to mean
-
03
Analytical logicSemantic model · transformations · queries
How the number is calculated
-
04
Data inputsSources · ingestion · identity rules
Which records enter the calculation
-
05
Accountable workOwnership · repair · tests · validation
How the result becomes trustworthy
The rule: AI inherits every definition, assumption, and failure in the layers below the dashboard.
The broken revenue number
Imagine that an executive asks, “Why is revenue in this dashboard different from the number finance sent me?”
The AI in your BI tool may explain the chart, show its filters, or produce the query behind it. That is a useful beginning. But resolving the disagreement may require moving through several different layers.
- Inspect the visible answer. Confirm the dashboard state, filters, date range, currency, grouping, and exact number the user saw.
- Find the business definition. Determine what “revenue” is supposed to mean here. Is it booked, billed, recognized, collected, gross, or net of refunds?
- Trace the implementation. Find the metric, semantic model, transformation, or query that implements that definition. Confirm that the dashboard is actually using it.
- Follow the dependencies. Inspect the upstream models, joins, tests, and lineage. One dependency inside a thousand-line query can change the answer without anything looking wrong in the dashboard.
- Compare the sources. Finance may use the billing system while the dashboard uses orders. The same transaction can arrive at different times, carry different statuses, or be corrected in only one source.
- Check system state. Look at freshness, failed jobs, schema changes, duplicate records, late-arriving data, and incidents that may explain the difference.
- Fix and validate. Change the definition, model, pipeline, or source logic; run the tests; rebuild the result; inspect the dashboard again; and compare it with the authoritative source.
- Record the decision. Update the shared definition and the history of why it changed so the next person—or AI—does not repeat the entire investigation.
That is the actual journey from question to trustworthy answer.
If your AI stops after step one or two, it has made BI better. It has not completed the data work.
Sometimes the answer is a ticket
There is another boundary that feature comparisons often miss: accountability.
Sometimes the person asking only needs help understanding an existing metric. Other times the definition is wrong, the model does not exist, the source lacks the event, or the pipeline has to be repaired. At that point, many systems create a ticket for the data team.
Creating the ticket is not the outcome. Someone still has to decide what should change, write the model, test it, deploy it, inspect the result, explain the decision, and maintain it later.
If you have an excellent data team with room in its schedule, that handoff may work. If your team is already swamped—or you do not have a data team—the question goes into a backlog. You bought faster access to the boundary and then discovered that the work on the other side still has no owner.
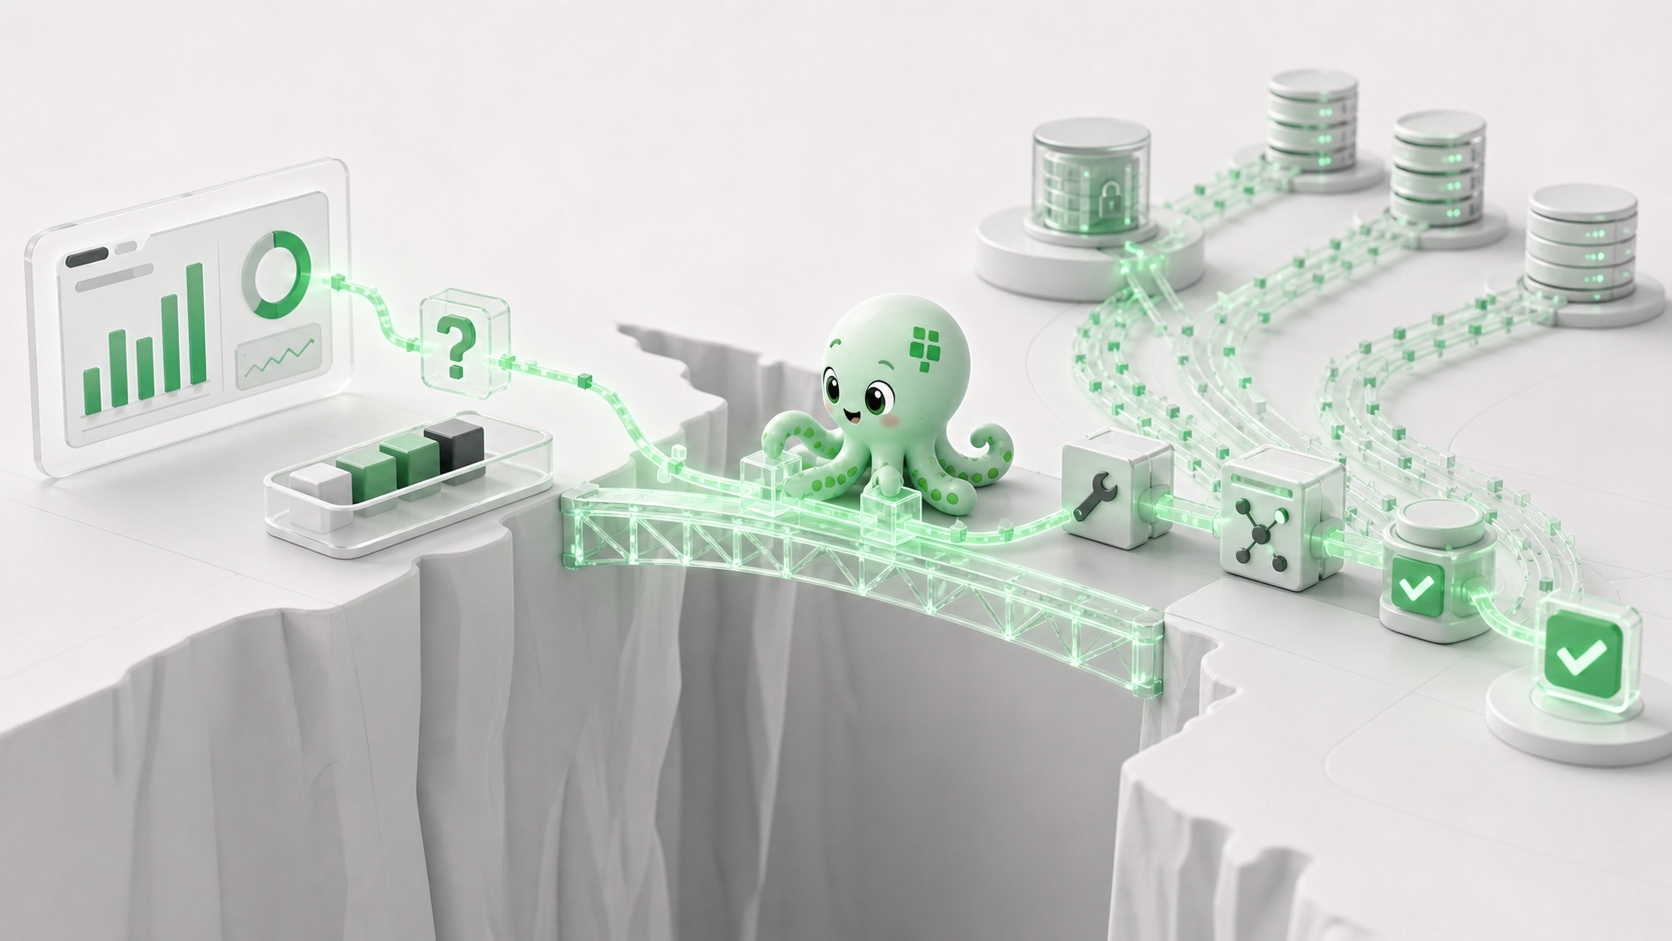
Decision testThe most important question is not whether the AI can answer. It is whether the system can keep working when the answer requires something to change.
Is AI for BI enough?
The answer becomes much clearer when you separate a better interface from a broader data-system problem.
AI for BI is enough when
- The important data is available and reliable.
- Metrics and definitions are governed.
- The main need is exploration, explanation, visualization, or self-service.
- A capable team owns modeling, ingestion, testing, and repair.
You need more than BI when
- Teams produce conflicting versions of the same metric.
- Definitions are disconnected from the logic that implements them.
- New questions require new models, sources, pipelines, or workflows.
- The work ends in an unowned or overloaded backlog.
In the first situation, ThoughtSpot, Omni, or another strong AI analytics product can create a much better interface to a sound system. In the second, making the dashboard layer more intelligent does not complete the work underneath it.
End-to-end AIWhat an AI-first data experience should do
If you are used to modern AI agents, you start expecting a different kind of experience.
You do not want the AI to explain one screen and then tell you to find someone else. You want it to understand the question, gather the relevant context, inspect the visible result, trace the underlying logic, identify what is wrong, make or propose the change, test it, deploy it, and verify the answer again.
That does not mean giving an AI unrestricted control or loading the entire company into one prompt. It means designing the system so definitions, models, lineage, jobs, source behavior, prior decisions, permissions, tests, and user-visible outputs are discoverable as the work unfolds. Important changes still need the appropriate human review.
Clarify the question, user, metric, and expected decision.
Read the visible result, filters, definitions, and current state.
Follow models, lineage, jobs, sources, and prior decisions.
Create or repair the model, definition, pipeline, or workflow.
Run checks, rebuild dependencies, and review the proposed result.
Inspect the user-visible answer and preserve the decision for next time.
The unit of work changes from “answer this question inside BI” to “produce and maintain a trustworthy data outcome.”
I explored the underlying context problem in The Data Stack AI Problem. Every disconnected tool boundary can become a context boundary. A useful agent needs a coherent way to move across those boundaries rather than asking a human to carry the context each time.
Why we built Polyform end to end
Polyform began as a consulting company. We tried to use the best ingestion tool, the best modeling tool, the best BI tool, the best task system, and whatever else a client needed.
The tools were good. The difficulty was that our team still had to cross every boundary manually.
When a number was wrong, someone had to open the dashboard, find the definition, inspect the model, trace the query, check the source, find the relevant task, make the change, run the tests, deploy it, and return to the dashboard. The people on our team were the integration layer.
We built Polyform because we wanted the system itself to preserve those connections.
Activity Schema organizes data around understandable business activities so definitions can be reused across reporting, investigations, decisions, workflows, and AI. The Polyform platform keeps sources, processing state, models, reports, tasks, and execution closer together. That gives AI the context and tools to investigate, build, test, inspect, and continue—while our team remains accountable for the result.
Polyform is not another AI BI point solution. It is your accountable data team, supported by a purpose-built platform. We can build a missing data capability or strengthen the team and stack you already have. Useful existing tools can remain in place; replacement is not a prerequisite.
The important difference is ownership. When a question reveals that a model needs to be created, a source needs to be repaired, or a definition needs to change, the work does not have to disappear into someone else's backlog.
Choose the system around the question
If your company already has reliable data, governed definitions, and people accountable for everything underneath BI, buy the AI analytics experience that your users will actually adopt. ThoughtSpot and Omni deserve serious consideration.
If your real problem is that answers conflict, definitions are disconnected, new questions require new data work, or nobody owns the complete journey, do not evaluate only the chat experience on top of the dashboard.
Give the system one broken number and see how far it can go.
Can it explain the chart? Can it identify the definition? Can it trace the model and every dependency? Can it compare the sources? Can it create and complete the work? Can it test the change, deploy it, inspect the result, and tell you whether the number is finally trustworthy?
That is how to tell whether you need better AI for BI—or whether BI is only one part of the journey you are actually trying to complete.